
FOR THE STEP BY STEP ORDER PRINTS TRAINING COURSE VIDEOS CLICK HERE
Each aspect of Order Prints is listed here in alphabetical order to make it easy to find and reference quickly. At the bottom is a breakdown of which aspects can be used for directional bias compared to trade management aids.
Apex Order Prints works on all instruments including Forex and can be plotted on Diagnostic Bars, Continuum / Shadow Bars, and on Time Based Bars. If using on Forex you must make sure to have all of the current Forex Futures Contracts loaded into your instrument manager within Ninja Trader ( 6A,6E,6B etc).
IMPORTANT NOTES:
- Always wait for the current bar to close to act on any signals you see. The symbols and numbers change during the formation of every bar. The big volume clusters are the only option that will not disappear once they show up, but they can move from one cell to another.
- There is a setting, “Show true/false,” under each option, and again in a Display Options section, for ease of seeing what is turned on and off. Adjusting the “Show true/false” in the section within the option itself will automatically update it in the general “Show Options” group section as well.
- NOTE: In NinjaTrader7, the Order Print indicator will not print historical data from during times when your charts were not open. It only prints when receiving real time data and it will store that information only for when your charts were open and data feeds were connected. It will work with market replay, it sees that data as real time. You must make sure to have the proper contract month loaded that matches the days you are trying to replay. So if you use NT7, never rely on the signals on the first bar, as it is only partial information from where you pulled up the chart and data started. (This is not an issue with NT8, but you must enable tick replay when loading the chart.)
- It helps to go into the Data Series (right click on the chart and select data series) and set the bar width to either 0 or 1. Sometimes it changes if you set it when you are setting up the chart to begin with and you need to reset it to 0 or 1 again.
- There are alerts on many of the options. Each option that has an alert has three possibilities. They are all defaulted off (unless you load a template with alerts on). The choices include visual, voice and windows flash. The visual causes the entire chart to flash when the option requirement is met. The voice gives you an audible alert you can hear. The windows flash will flash in your ninja icon in your system tray. This is helpful if you have a workspace up that is minimized.
- The current predefined templates show mostly order prints only are _OP Simple ALL and _OP Simple ES. The latter is used when charting /ES, the former for all others.
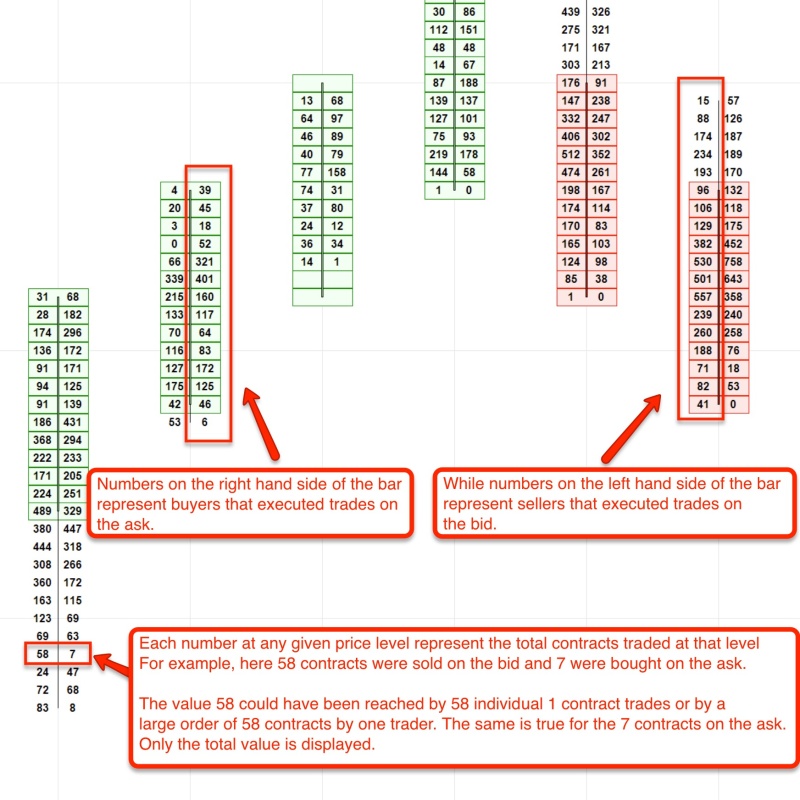
Order Prints orders explained:
TERMS AND DEFINITIONS
Absorption
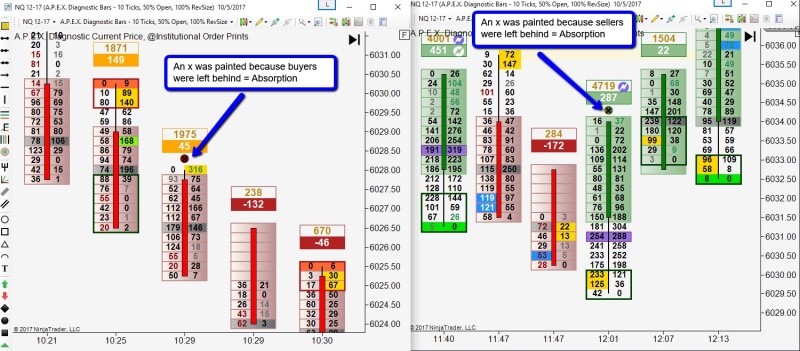
Absorption occurs when either:
(A) More buyers than sellers came in, but instead of moving the market long, the market went short,
or
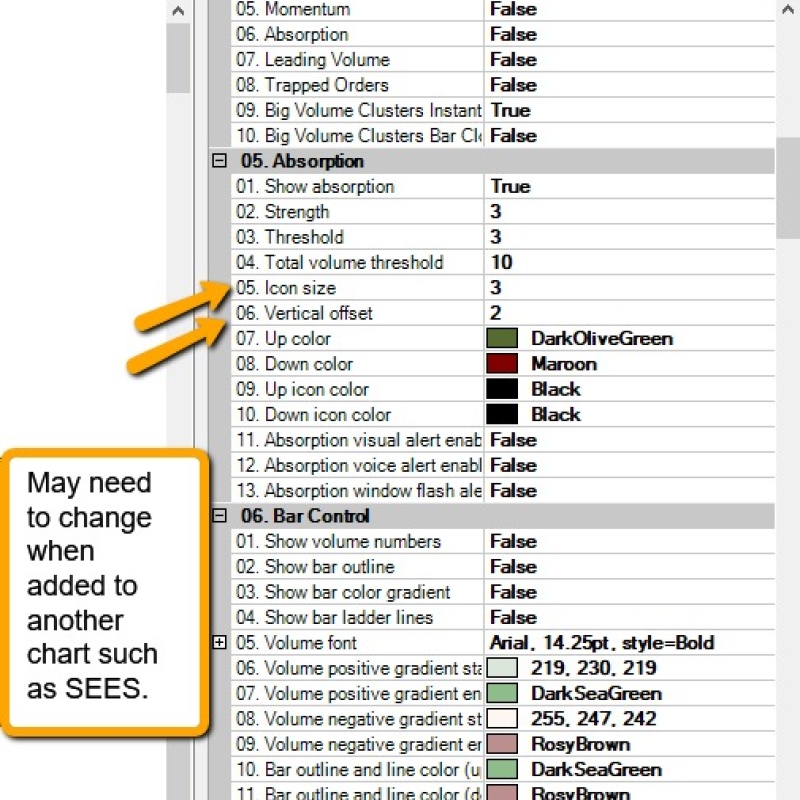
(B) more sellers than buyers came in, but instead of moving the market short, the market went long. When this happens an X will appear above the bar. This option can be toggled off by setting “Show Momentum/Absorption” to false. There is an alert for this option. The colors default to a dark red with a black X, if the buyers are absorbed and a dark green with a black X if the sellers are absorbed indicating the direction the market is stronger at that moment. These colors can be changed in settings under Absorption. The default settings will normally work for most markets; however, they are user adjustable for size and strength. The icon size can be changed. It is defaulted to 1 to fit on an plain order prints chart. When it is added to a another chart, you may wish to change the icon size to 2 or 3 and change the offset to 2 or 3 like the screenshot below:
Acceleration
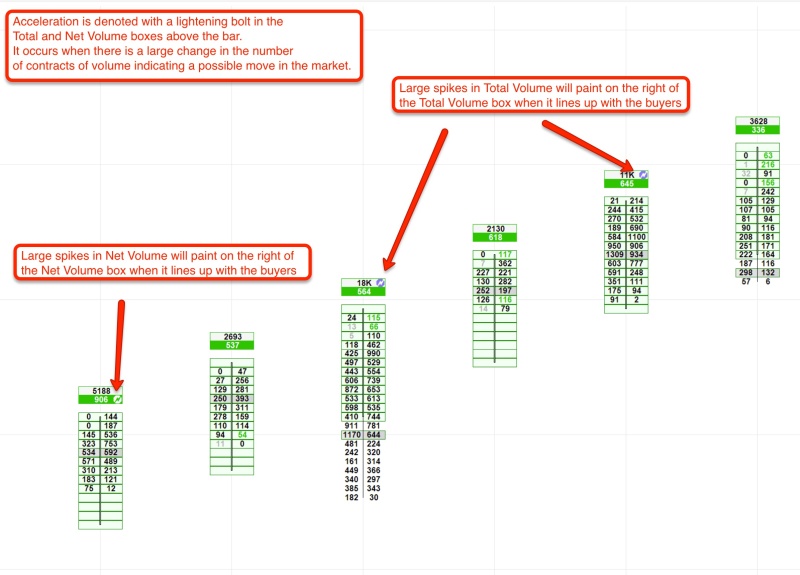
Acceleration is denoted with a lightning bolt in the net volume box or the total volume box. (See: Total Volume Acceleration or Net Volume Acceleration).
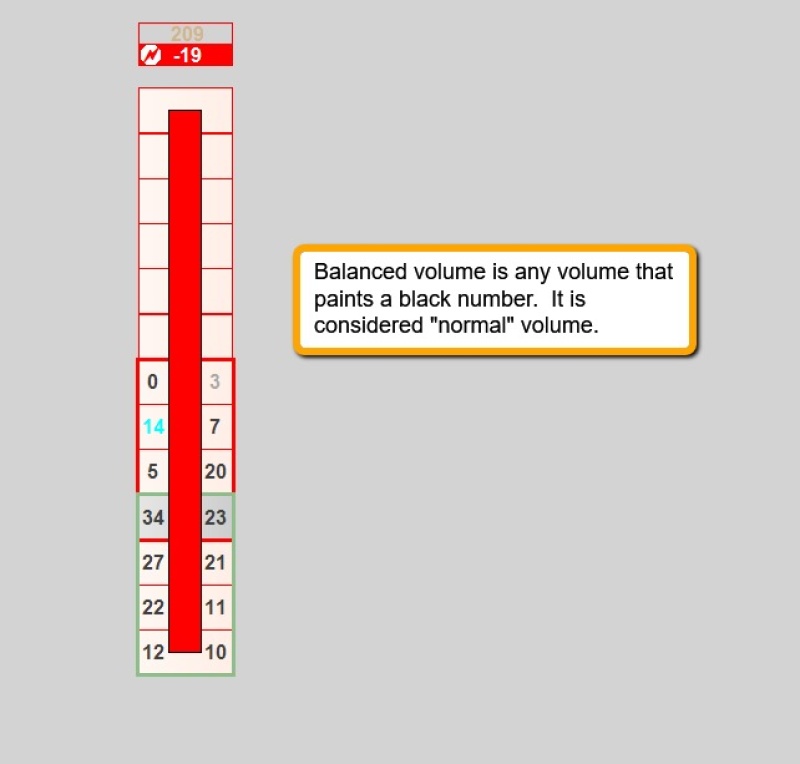
Balanced Volume
Balanced volume is any volume that is considered “normal” volume. It prints black by default. This can be turned off by setting “Show Balanced Volume” to false if you do not want to see all the “normal” numbers. One reason for turning this option off is to take some of the “noise” off the chart.
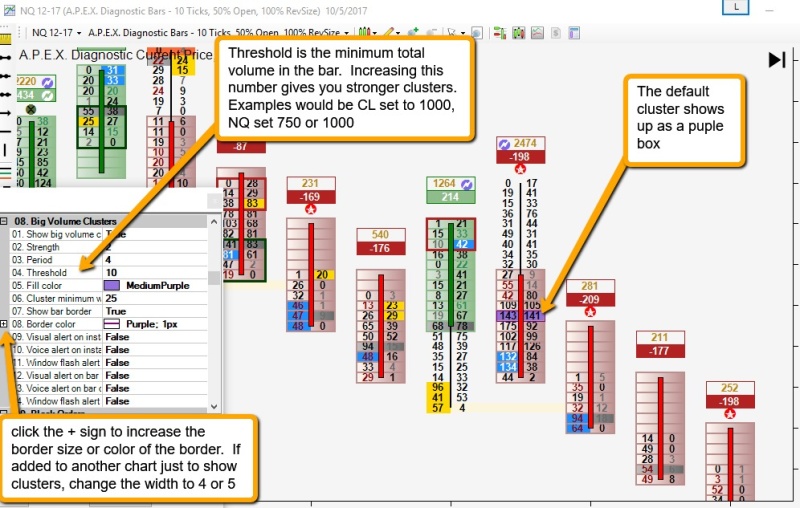
Big Volume Clusters
Clusters are denoted by a buildup of volume in the bar. If there are several clusters in one small area, chop often follows. Because it compares volume in the current bar to previous bars, big volume clusters must have at least 4 full bars of data in order to print a signal. Once a cluster is printed on the chart, it will not go away, but it may move to a different cell inside that bar. There are several settings that can be adjusted and are explained on the screenshot. There are two types of alerts on the big volume clusters. The first three alert settings pertain to instant alerts. These alerts will trigger as soon as the cluster prints. The second three alert settings will trigger when the cluster bar closes. Sometimes the cluster bar can take a long time to form, so this alert was added to get your attention back to the bar when it closes for a possible trade entry.
As usual, all alerts are defaulted off so you can choose which ones you want to use. The threshold setting is an extra filter to keep clusters from printing when the volume is very low. They trigger easier when volume is very low, but the setups triggered are often not the ones to take. To filter those out, set the threshold higher. This will vary by market and time of day. The default is set to 10 on the indicator because it changes by market.
Blocks (See: Institutional Blocks)
Divergence (See: Net Volume Divergence and Net Block Divergence)
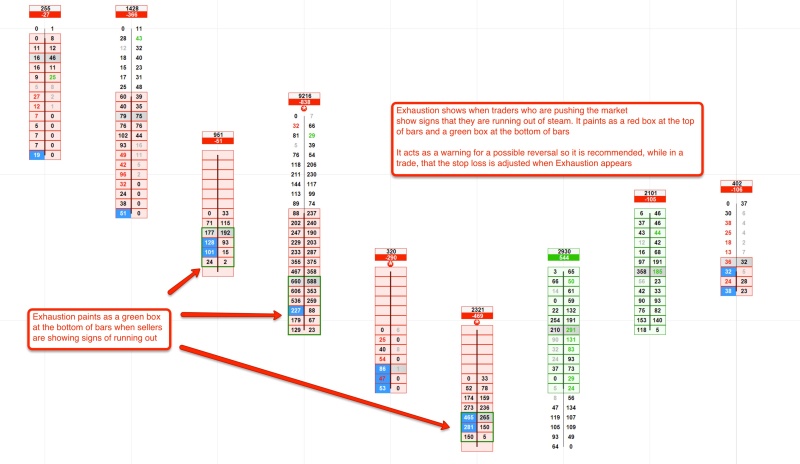
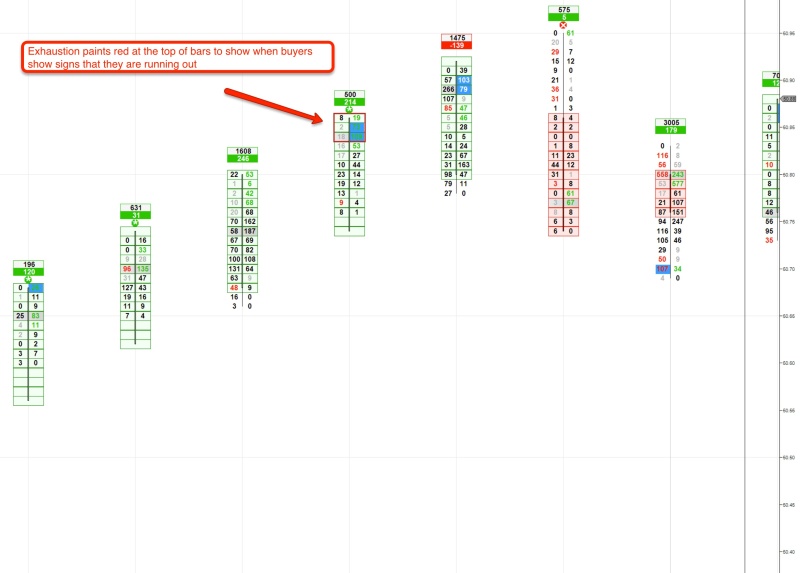
Exhaustion
Exhaustion is designated by a red box at the top of a bar or a green box at the bottom of the bar. When a red box appears at the top of a bar, it can signify the buying trend may be coming to an end, and this may be a good time to tighten stops and manage risk. Conversely, if a green box appears at the bottom of a bar, this could signify the selling trend is losing steam and may be a good time to tighten stops. If a box occurs at the top and bottom of a bar, it could indicate chop. The colors of the boxes can be changed by changing the “Line for Volume Exhaustion” in settings. This option can also be toggled off by setting “Show Exhaustion” to false.
Imbalances
Imbalanced volume occurs when volume in a cell on one side greatly exceeds the volume on the other side. Imbalances (strong imbalance side) show up as a red color, if on the bid/left side and a green color, if on the ask/right side. These colors can be changed if desired, as well as the font color.
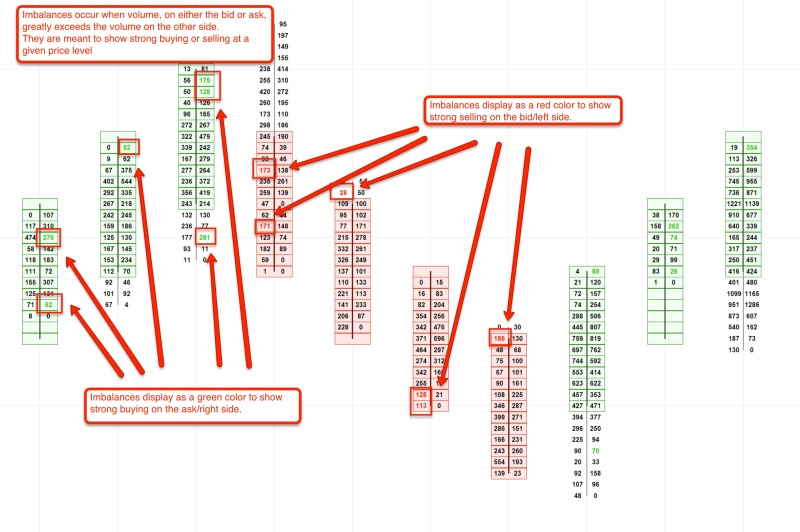
Settings: The “Strength” setting set higher will mean the imbalance will be greater before it shows up on the chart. The volume filter gives a minimum number of contracts to show up in an imbalance before it prints. “Show Imbalance” set to false means no imbalances will show up on the chart. If show imbalance is set to false, all imbalanced volume will show up as “balanced” or normal volume.
See also: Weak Imbalances
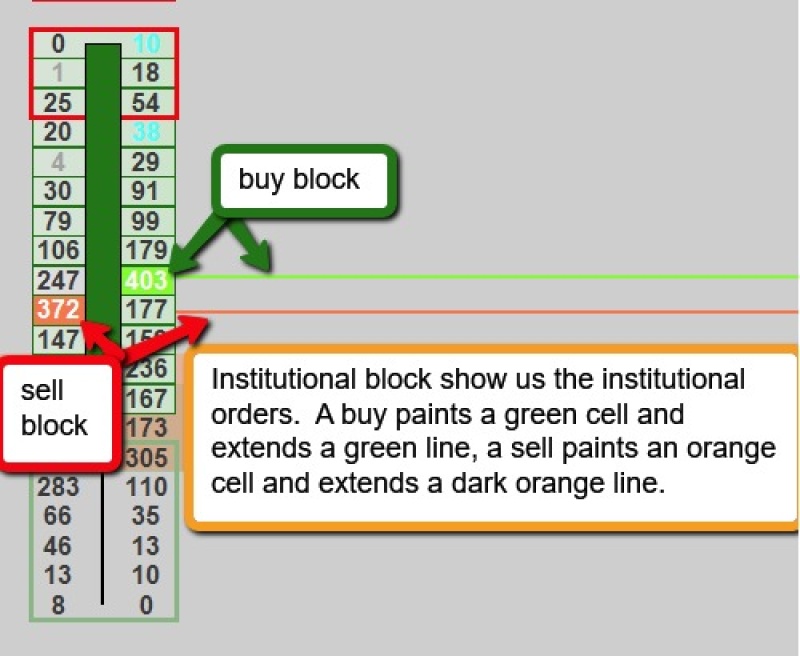
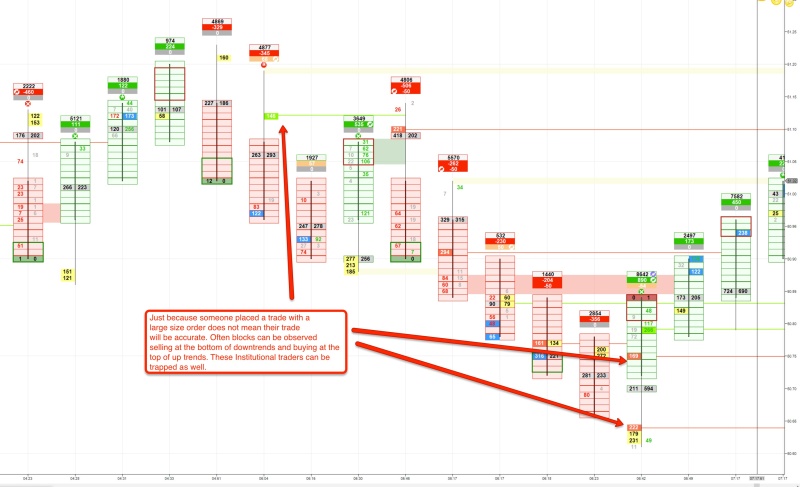
Institutional Blocks
Institutional blocks show us the big orders. A buy block paints a green cell and extends a green line. A sell block paints an orange cell and extends an orange line. There are several settings that can be adjusted under “Block Orders.” To change the size of the blocks, increase or decrease the “Size” number. The color of cell and color of the line can be adjusted, as well as the font color. To prevent the cell from being highlighted, simply set “Highlight Blocks” to false. If it is preferred to not see the line extended at all on the chart, set “Show Block Line” to off. Another choice is whether or not to show the block line after that level is “broken” by the price action. To not see the block line after it has been broken, set the “Show Broken” setting to false. If it is set to true, the line will continue until chart data is reset.
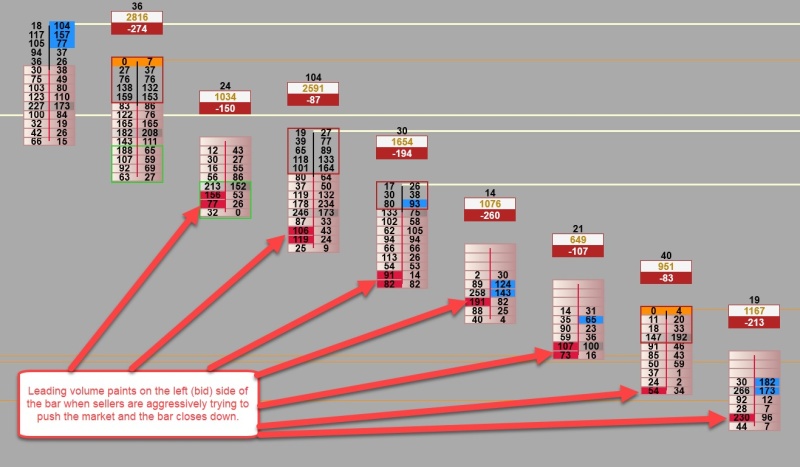
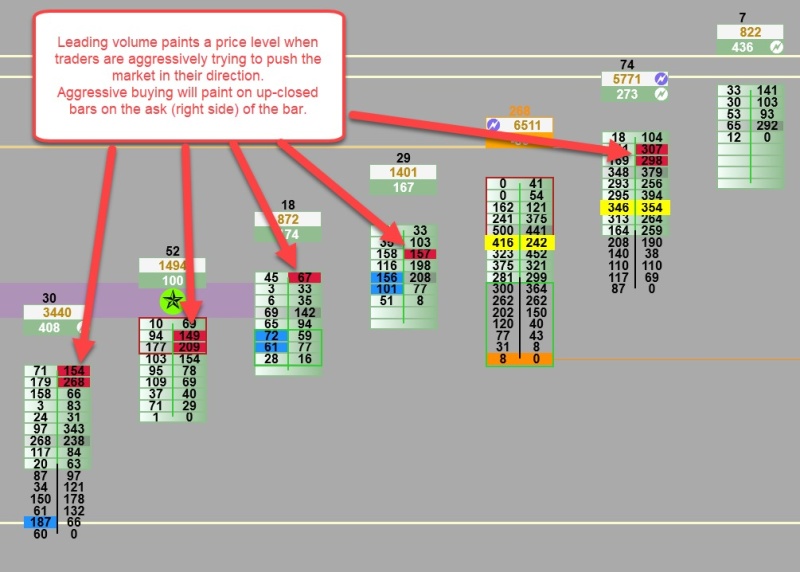
Leading Volume
Leading volume is heavy volume in the direction of the bar’s close. Therefore, it will always paint on the left (bid) side of a down-closed bar, and the right (ask) side of an up-closed bar. The settings are defaulted to work with most markets but are adjustable. “Show Leading Volume” can also be toggled to false to turn this feature totally off. There is an alert for this option.
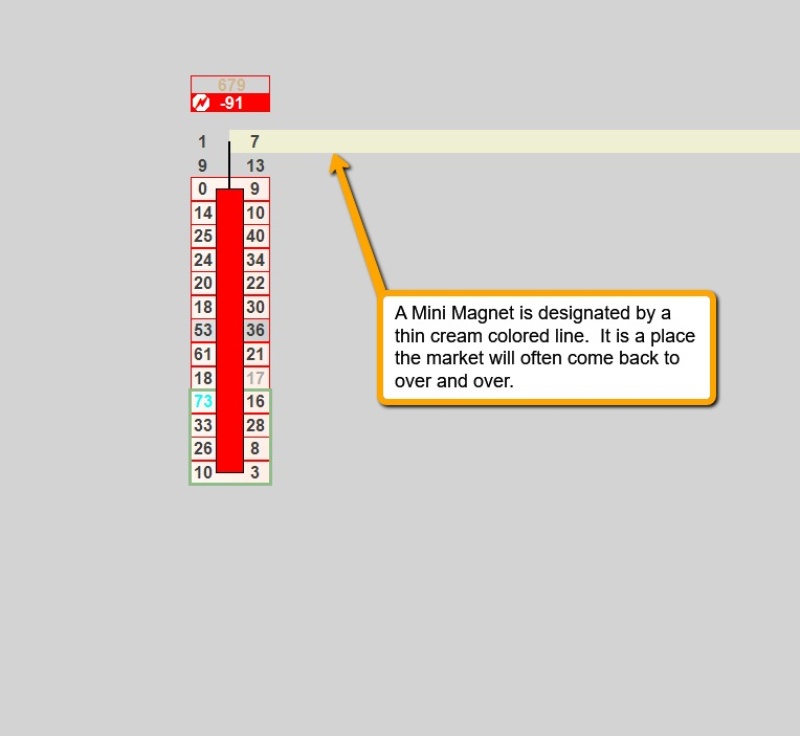
Mini Magnets (mm)
(Most powerful when used on diagnostic bars.) A Mini Magnet is denoted by a line. The lines can have each day be a different color. This option was added so you can track which day a mini magnet is painted and if the price keeps coming back to it for days. The default is all lines being a cream color to keep it simple. The mm is a place the market will often come back to. If a setup occurs and the setup bar laid down a mm, it strengthens the setup. If there are many mini magnets in a small area, this is a good early indication of chop.
MM can be set to not show after they are broken by price action, or you can extend past broken for a number of days the user selects. The broken mm can be set to paint a different color to be able to see if price still responds to that area for a while. The broken mm color can be set the same color as the non broken lines but change the opacity. This will print the broken mm much lighter to give you an easy indication that it was broken with the color being the same as the color that was assigned to that day. (Tip for colors: you can assign the color that starts with the same letter as the day, i.e., Monday is mauve. Another option for color coding is to start Monday with a light color and increase the darkness of the color each day until the darkest color prints on Friday.)
Many times the mm will happen at very big levels that will become the next day’s settlement or Ice levels. There is a setting called “threshold.” This is defaulted to 1 to show all mm. The higher the number, the more filtered they become and only the strongest ones will print. There is an alert for mini magnets. This is defaulted off.
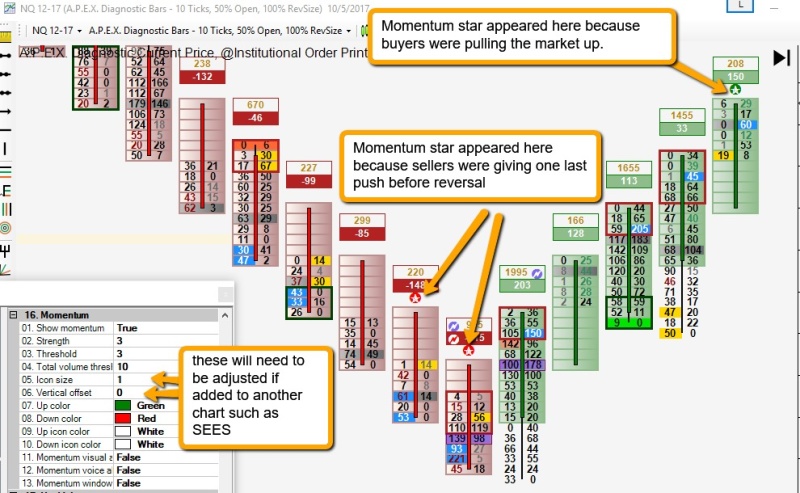
Momentum
Momentum is used to identify when buyers are pushing the price in their direction, overcoming the sellers, which is indicated with a star on the ask/right side above the bar. If the star is on the bid/left side, it means the sellers are pushing the price short and overcoming buyers. The default settings work well in most markets with settings adjustable if desired in size, strength, and color. This option can also be toggled off by setting “Show Momentum” to false. There is an alert for this option. The colors default to a red with a white star if the sellers are pushing and a green with a white star if the buyers are pushing These colors can be changed in settings under Momentum. The icon size can be changed. It is defaulted to 1 to fit on an plain order prints chart. When it is added to a another chart you may wish to change the icon size to 2 or 3 and change the offset to 2 or 3 like the screenshot below:
Net Block Divergence
Net Block Divergence occurs when the Net Block Numbers do not agree with the bar direction. This option can be toggled off.
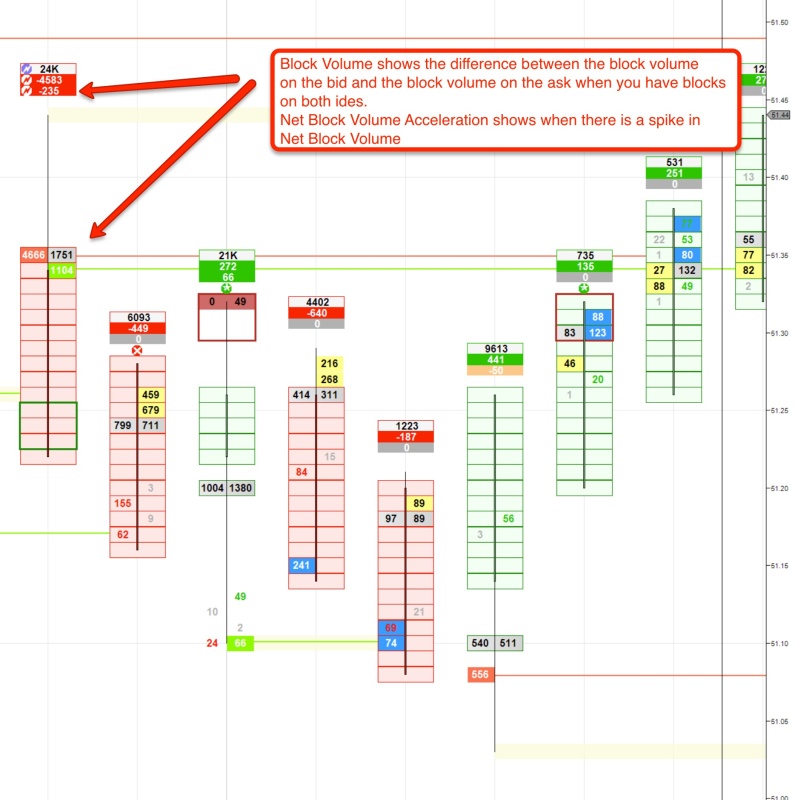
Net Block Volume
Net Block Volume shows up in a box above the bars. It is the net volume of the blocks. It is located under Total Volume. It is highlighted green if there are more buy contracts, red if there are more sell contracts. This also can be toggled off by setting “Show Net Block Volume” to false.
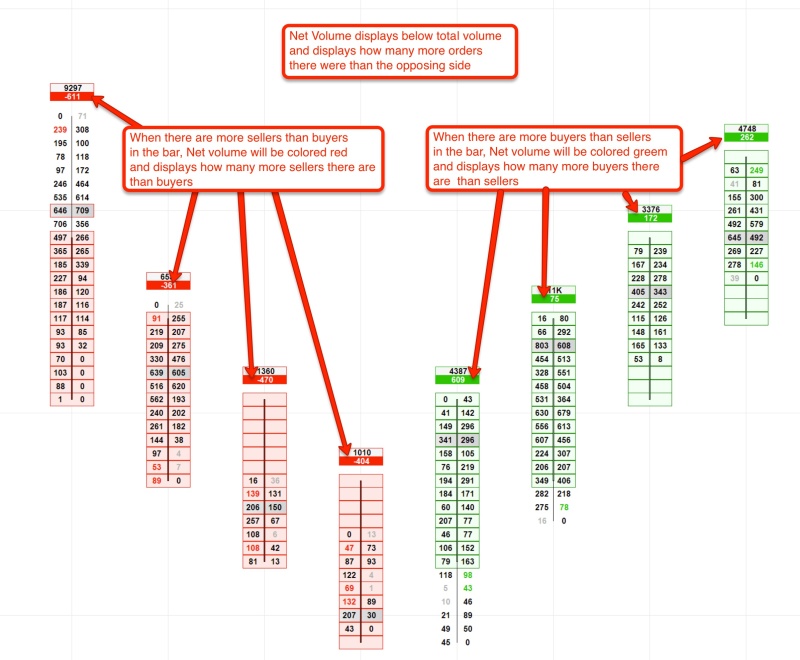
Net Volume
Net volume is denoted in a box above the bars. It is located in the box underneath Total Volume. It is highlighted green if there are more buy contracts, red if there are more sell contracts. This can be toggled off by setting “Show Net Volume” to false.
Net Volume Acceleration
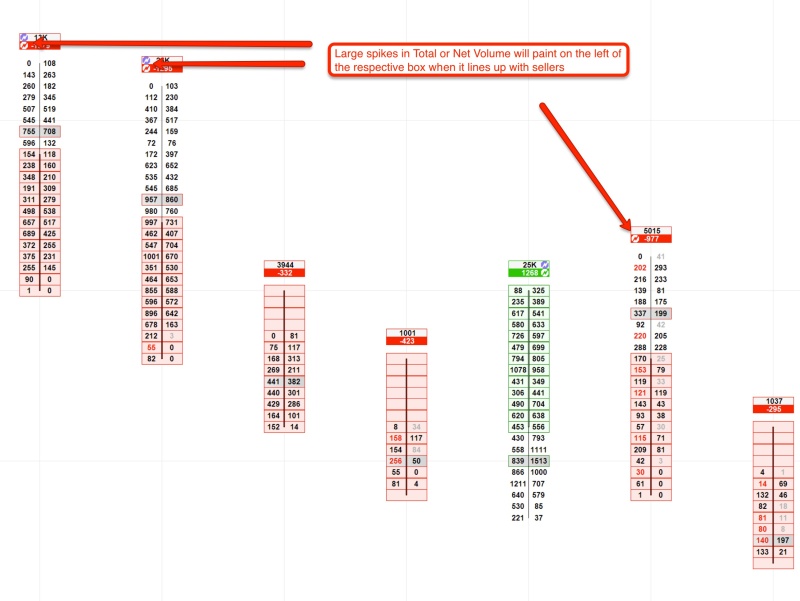
Net Volume Acceleration is denoted with a lightning bolt in the Net Volume box above the bar. It occurs when there is a large change in the number of contracts of net volume indicating a possible move in the market. If the acceleration is buy contracts, the bolt will paint on the ask/right side. If the acceleration is sell contracts, it will paint on the bid/left side of the number in the Net Volume box. The color is also user adjustable. The period and strength settings are defaulted to fit most markets. However, if trading ES, for example, and bolts are showing up too often, the period and/or strength setting can be adjusted. Net Volume Acceleration can be toggled completely off by setting “Show Net Acceleration” to false. Net acceleration must have 3 bars of data previous to the current bar to print. There is an alert for this option.
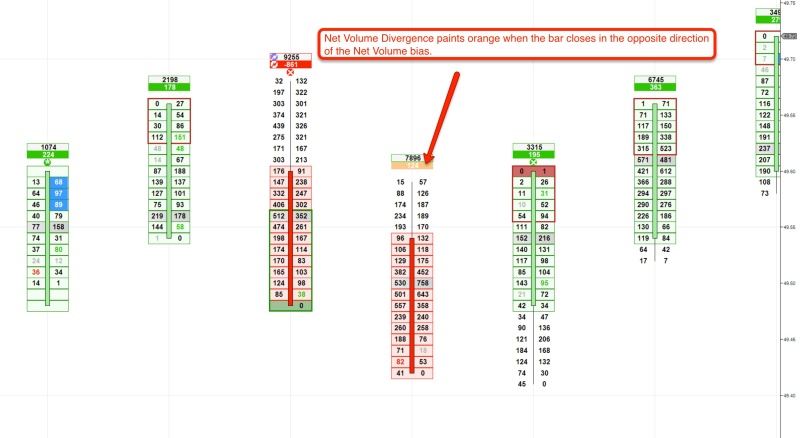
Net Volume Divergence
Net volume divergence happens when the net volume does not agree with the bar direction. This option can be toggled off.
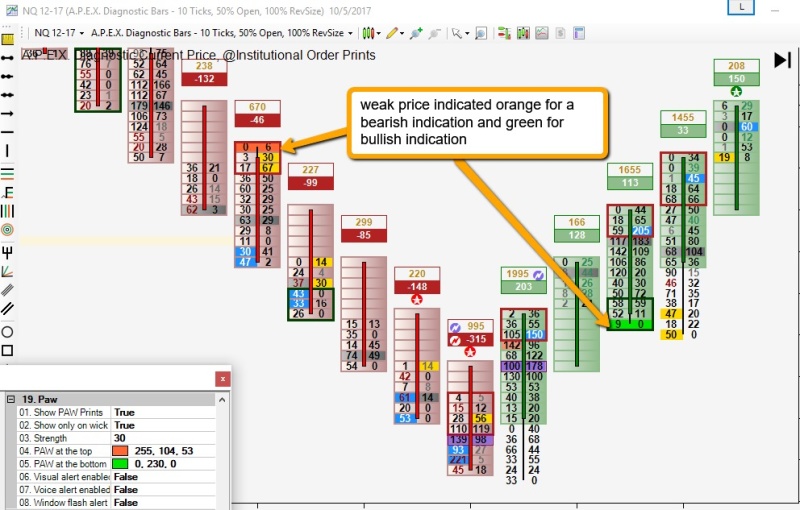
Paw Prints
Paw Prints are designated by a colored level at the top or bottom of a bar. It helps identify a weak price level with a possible end to the momentum of the market, which may be a good place to tighten the stop. The setting that shows true “only on wick” is set to true to give the strongest paw print indications.
Total Volume
Total Volume is displayed in a box above the bar with a white-colored background.
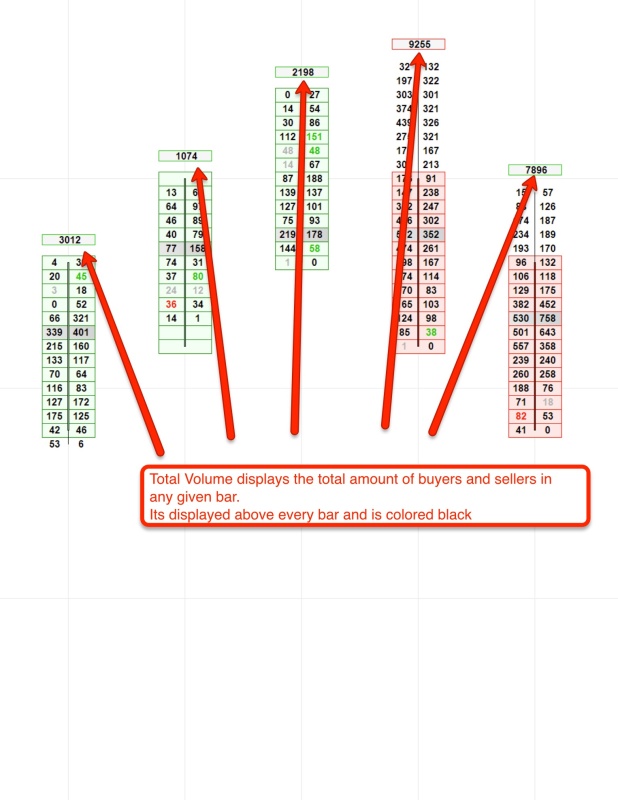
Total volume can be toggled off by setting “Show Total Volume” to false.
Total Volume Acceleration
Total Volume Acceleration is denoted with a lightning bolt in the Total Volume box above the bar. It occurs when there is a large change in the number of contracts of volume indicating a possible move in the market. If the acceleration is buy contracts, the bolt will paint on the ask/right side. If the acceleration is sell contracts, it will paint on the bid/left side of the number in the Total Volume box. The color is also user adjustable to fit your charts color scheme. The period and strength settings will fit most markets; however, if trading ES, for example, and bolts are showing up too often, the period and/or strength setting can be adjusted. Total Volume Acceleration can be toggled off by setting “Show Acceleration” to false. There is an alert for this option. Total acceleration must have 3 bars of data previous to the current one to print.
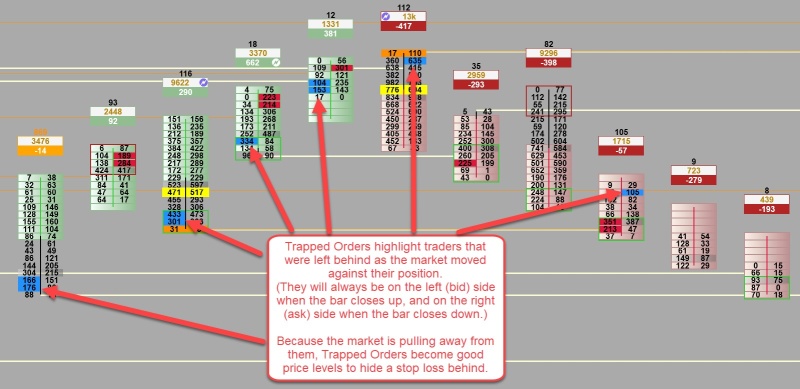
Trapped Orders
Trapped orders are designated by a colored cell at a level they were noted. These buyers or sellers are stuck as the market moves against them. There are a few options that can be user adjusted. The settings are defaulted to fit most markets. If trading ES, for example, where the number of contracts is very large, the settings can be increased. The Trapped Orders option can be totally turned off by setting “Show Trapped Orders” to false. There is an alert for this option.
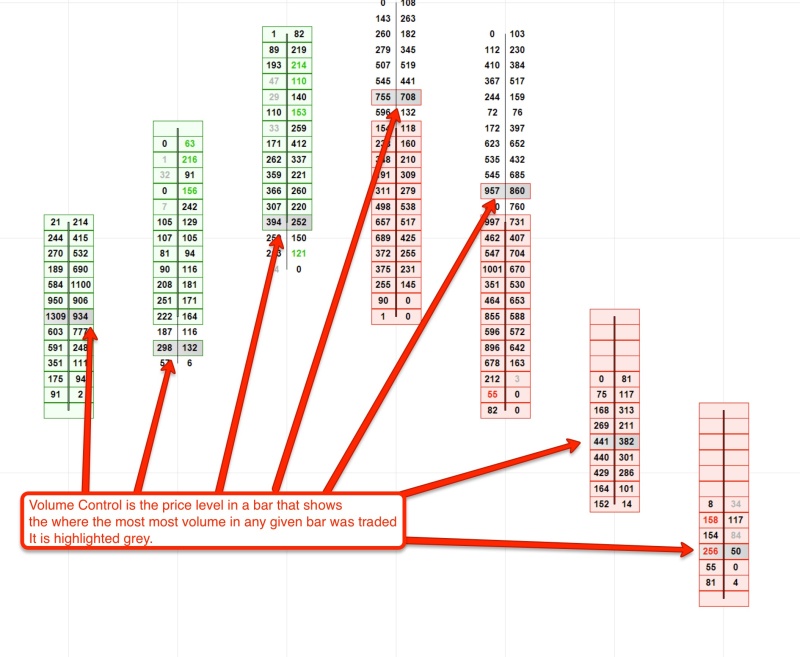
Volume Control
Volume Control is designated with a gray colored cell that can be turned off by setting “Show Control Price” to false. The color may be changed to any color the user prefers.
Volume Imbalance
This can act as a nice confirmation when deciding whether to enter a signal. If there is a volume imbalance with the strong volume on the bid/left side, this could give an indication the market may go short. If the strong side appears on the ask/right side, then it could indicate a move to the long side is more favored. Colors, strength, filter and font can be adjusted in this option as well as whether or not to show this option at all. ( See “Imbalance” section above)
Weak Imbalanced Volume
Weak imbalance displays the lesser half of the imbalanced volume picture. An imbalance shows a weak side which displays the side with low volume and a strong side in which more volume occurs.
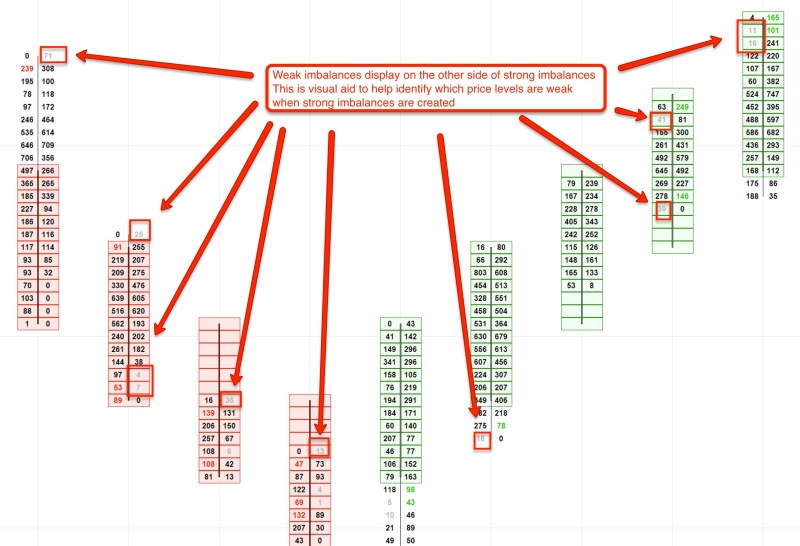
Weak Imbalance can be toggled to false and then will print as normal volume.
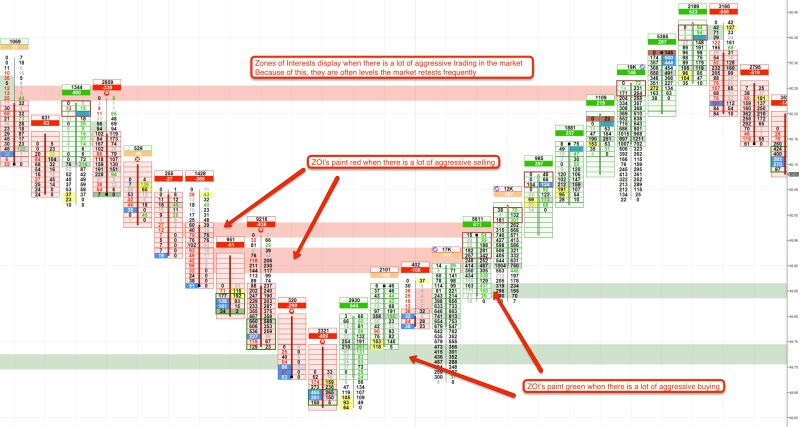
Zone of Interest (ZOI)
A Zone of Interest is a strong zone the market will come back to. The default settings will work with most markets, but are adjustable by the trader for minimum volume levels and manual or automatic mode. When the setting “Show Broken” is set to false, the ZOI will stop showing when the market comes back to it. If that option is set to true, the ZOI will continue to print for a maximum of 5 days with NinjaTrader 7. There is an alert for this option.
Now that we have all the features for Order Prints detailed in how they operate, this is a guide on how they may be used. Features can be used multiple ways with millions of different potential setting combinations. However, this is a basic guideline outlining how these features may be utilized.
To understand these features best, it is easiest to break them down into two categories, directional bias and trade management. Directional bias will give an idea as to where the market is going. Trade management will deal with stop and target adjustment. Some features will fall under both categories. How to utilize features in both contexts will be outlined here:
Directional Bias Features
Total Volume Acceleration: Gives bias when looked at with market movement.
Net Volume: Gives bias after bar close
Net Volume Acceleration: Gives bias after bar close
Paw Prints: When looking at support and resistance levels, Paw Prints can identify when a level is weak or when a stop run has taken place
Momentum: Gives immediate bias after bar close based on a cluster of traders pulling the market
Absorption: Gives immediate bias after bar close based on a cluster of trapped traders
Leading Volume: Helps show when big volume is moving with the market
Imbalances: Signifies aggression intrabar. They have to be taken in context with market movement to accurately establish bias
Zone of Interest: Signifies multiple aggressive traders in one location to give bias.
Block orders: Can give bias when looked at with market movement
Optional Advanced Features:
Net Block Volume: Can give bias if the Net Block Volume is significant as size can indicate market direction
Net Block Divergence: Can signify a possible change in direction or possible end to a trend
Net Volume Divergence: Can signify a possible change in direction or possible end to a trend
Trade Management Features:
Mini Magnets: Can be used for stop management and target placement
Zone of Interest: Can be used to move stops behind
Volume Control: Can be used for stop management
Block Orders: Can be used to move stops behind
Paw Prints: Signal to tighten stop if this occurs while market moves in your favor
Trapped Orders: Can be used to move stops behind
Weak Imbalanced Volume: Can be used to move stops behind
Exhaustion: Signal to tighten stop if this occurs while market moves in your favor
Big Volume Clusters show a buildup of orders. This can be used to confirm an entry or pull stop close to protect profit.
Click HERE to share your findings about any of these features