
Chances are if you are an oil trader (CL) you may not have known that there is a Volatility Index that can help you in your trading. It is available on CBOE.com. The OVX is defined there as measuring “the market’s expectation of 30-day volatility of crude oil prices by applying the VIX methodology to United States Oil Fund, LP (USO) options spanning a wide range of strike prices.”
By looking at the following image, you can see how, if you were to implement using the OVX into your trading, you would have another club in your golf bag. Trading is like golfing. You don’t just use one club. You have to have more than just a putter to succeed in the game of golf and you have to have more than just one tool to use in your trading day.
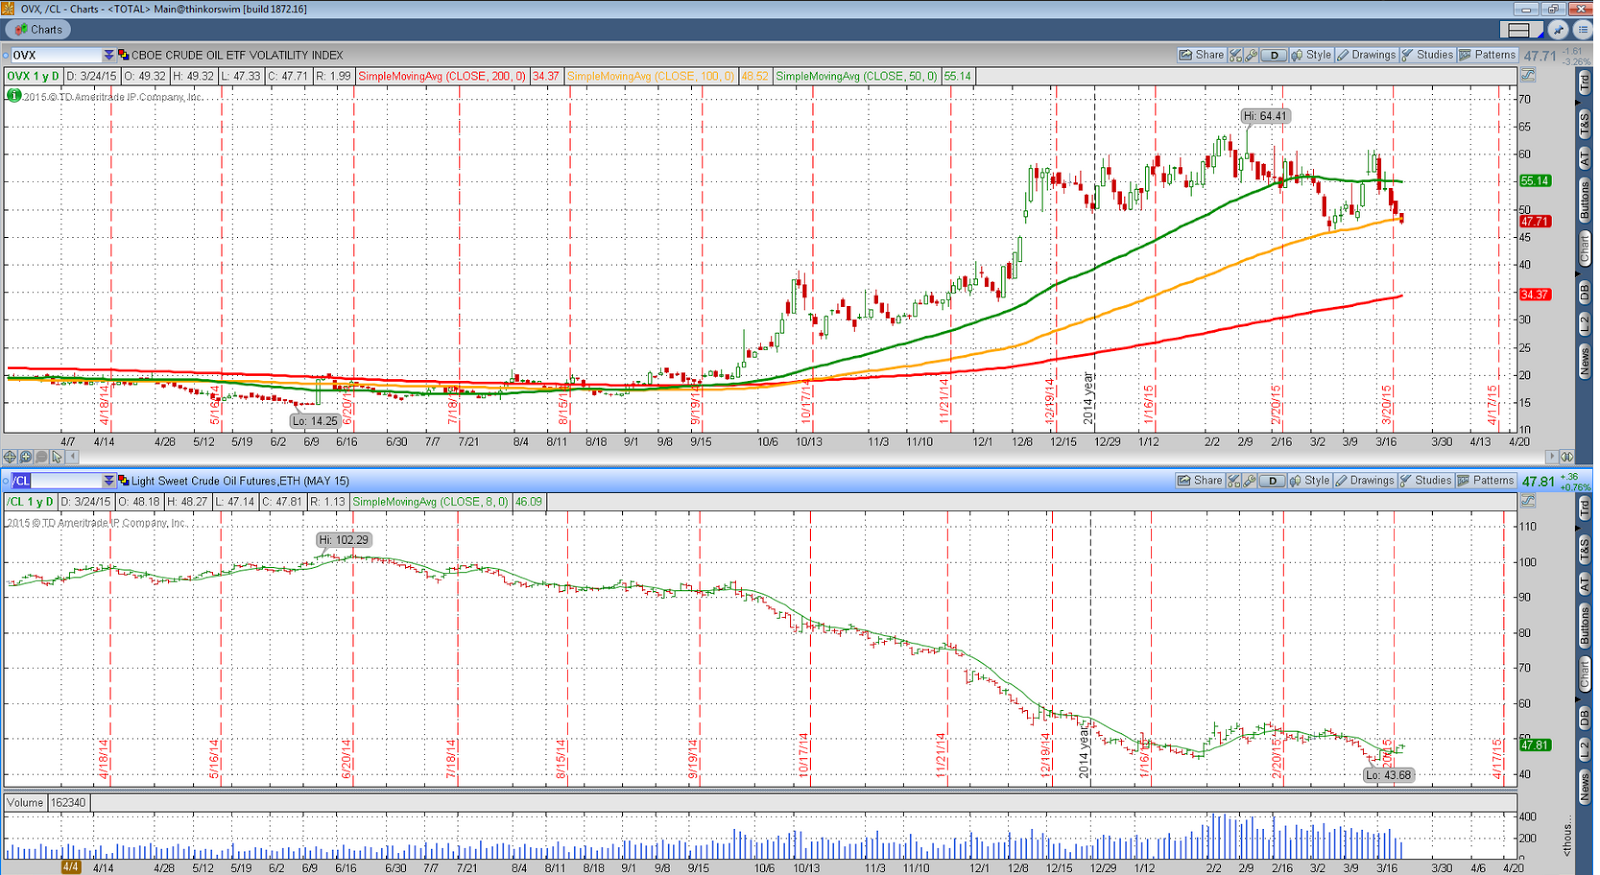
When you compare what is happening on the OVX with what is on CL, you can see that as volatility goes up, the market goes down. You can also see the lines that have been placed on OVX that signify the amount of volatility: Red= 200 which is low. Orange = 100. Green=50 which is high. The market is more volatile if the chart is above all three lines. It is less volatile if it is below all three.
You can use the Volatility Indexes if you are trading Stocks, Options, Commodities, ETF, Futures or Nadex Binaries. It is an effective tool to help you determine which strategy or system would best enable you to reach your trading goals.
The following video will give you more insight using OVX in your oil trading. Click HERE to watch the video. Learn more at ApexInvesting.com, a service of Darrell Martin.