darrell
October 29, 2015, 9:25pm
21
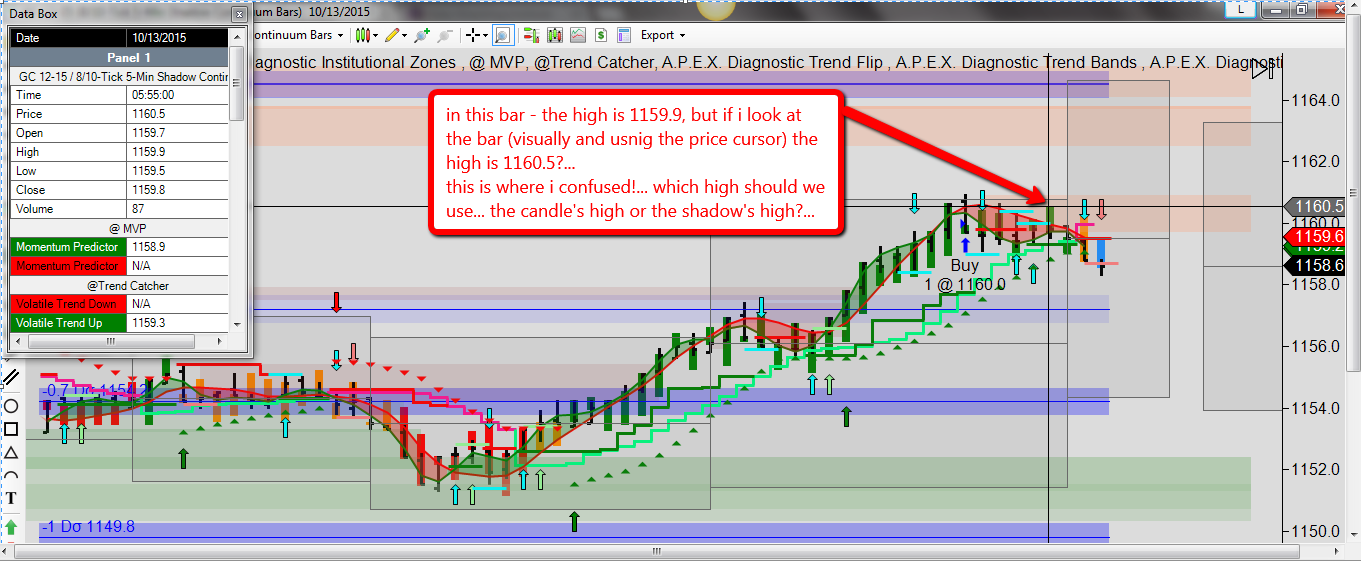
is kind of misleading… bcos if the candle is what showing the actual price action, why the bar’s shadow is painted above or below, bcos visually it conveys wrong high or low… - i 'm sure i 'm really missing big thing here… but this seems to be more accurate and new bar style acc. to darrell in the video… but i just didnt get it even after i watched video again… great i you can explain with an example of actual candle’s ohlc and shadow’s ohlc - what is the difference and why and which one we should focus on?..
appreciate your help!..
https://forum.apexinvesting.com/uploads/default/original/2X/d/dbbb49e2fdd068c6dada39299f404fa4975feaad.png
not sure why your looking at that bars high. The entry would be 3 ticks above the high of the previous bar. Though you would not be entering as your in a sell zone.
Entries are above the high and below the low of the bar (they have nothing to do with the shadow.)
darrell
October 29, 2015, 9:27pm
22
https://forum.apexinvesting.com/uploads/default/original/2X/f/fe6a436710944ae4d8ed925ee6e13dbcc0499607.png
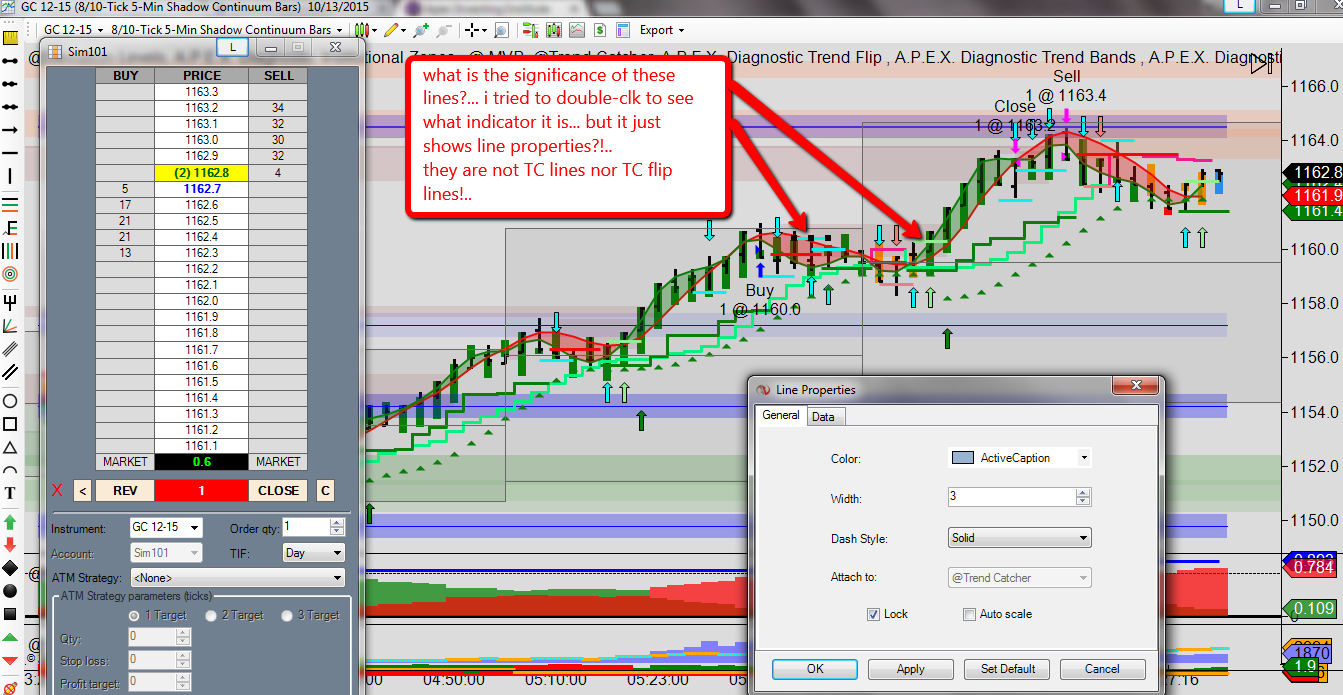
Those are lines that trend catcher plots you are free to make them Transparent in the TC settings.
They derive from the old TC where the lin is plotted based on the pending TC as cyan and changes color when broken.
darrell
October 29, 2015, 9:28pm
23
for the reply… actually i have the confusion on the concept behind the bars when i moved from diag to shadow… infact when i was using diag bar, i did not have this, bcos i didnt really bother about how it is formed/closed etc as long as i simply follow the recommended settings… all i did care was when to enter and exit and how to find that point (3 ticks above/below of the high/low of so and so bar based on the system chooses)… eventually i was going to dig deeper into this as i 'm basically a technical person curious to know how it works… but to start with i purposefully limit myself as a “user” of the tool rather than how it is built and logic behind it etc… but when i moved to shadow bar , i came across the actual bar’s high/low and the shadow’s high/low…
now after i went thru the study section of diag and shadow bars - i understand the shadow is nothing but to mimic the visual appearance of diag bar (smoothing effect) as ppl are used to that all along… and also i see the "true ohlc of the bar in the shadow bar which is the actual whereas in case of diag bar the open is not real and since the open is not real, we cant see the price movement within the bar, though we have HLC…
having this understanding, i believe shadow bar without shadow is more visual reflection of the price action and i personally choose shadow off.
btw, i 'm ok with izone ss system rules/entry/exit etc… and using the _izoness template mentioned in the video… however i couldnt figure out the extra ‘line’ (other than trend catcher line, trend flip line, mvp triangle line)… so appreciate if you could clarify on this…
questions about bars are all fine
The issue is your confusing shadow bars with continuum bars. Shadow bars do not have time as part of the equation Continuums do.
