
By Darrell Martin
There are lots of things in life where you can find hints or leads to answers through a correlation of two sets of data. Like looking at children then at their parents, that often is enough to confirm those adults are indeed the parents of the children. Lung cancer is correlated to smoking. Excessively eating candy is linked to cavities or weight gain and the list can go on. There are also markets where, if you track them, you can find correlation of price movement between them, which in turn can give you indication, and/or confirmation, and an extra edge throughout the day for your trades.
The US Dollar Index, also known as USDX or DX, is a weighted geometric mean of the dollar’s value compared to 6 other specific foreign currencies, making up the index. The following is a list of the currencies and their respective percentages.
o Euro (EUR), 57.6% weight
o Japanese yen (JPY) 13.6% weight
o Pound sterling (GBP), 11.9% weight
o Canadian dollar (CAD), 9.1% weight
o Swedish krona (SEK), 4.2% weight
o Swiss franc (CHF) 3.6% weight
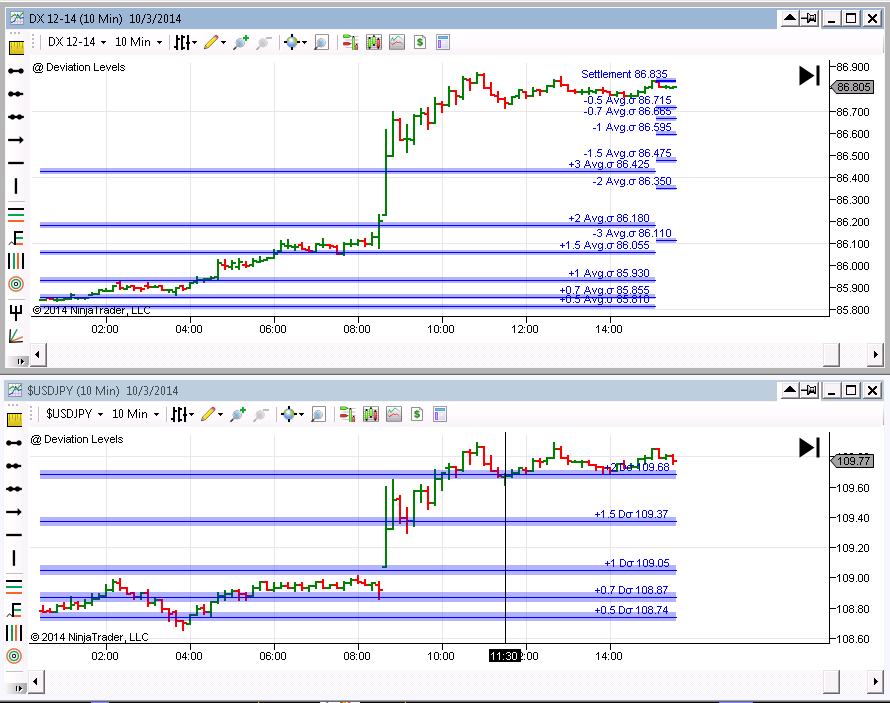
What does that mean for trading though, and where is the correlation to have an edge while trading? Many times the DX will move inversely to dollar denominated assets, meaning when the DX is trending up, the dollar denominated assets may be trending down, or vice versa. Dollar denominated assets are those priced and traded in US dollars. The US Indices would be an example, as well as Gold GC, Crude Oil CL, Bonds and Notes.
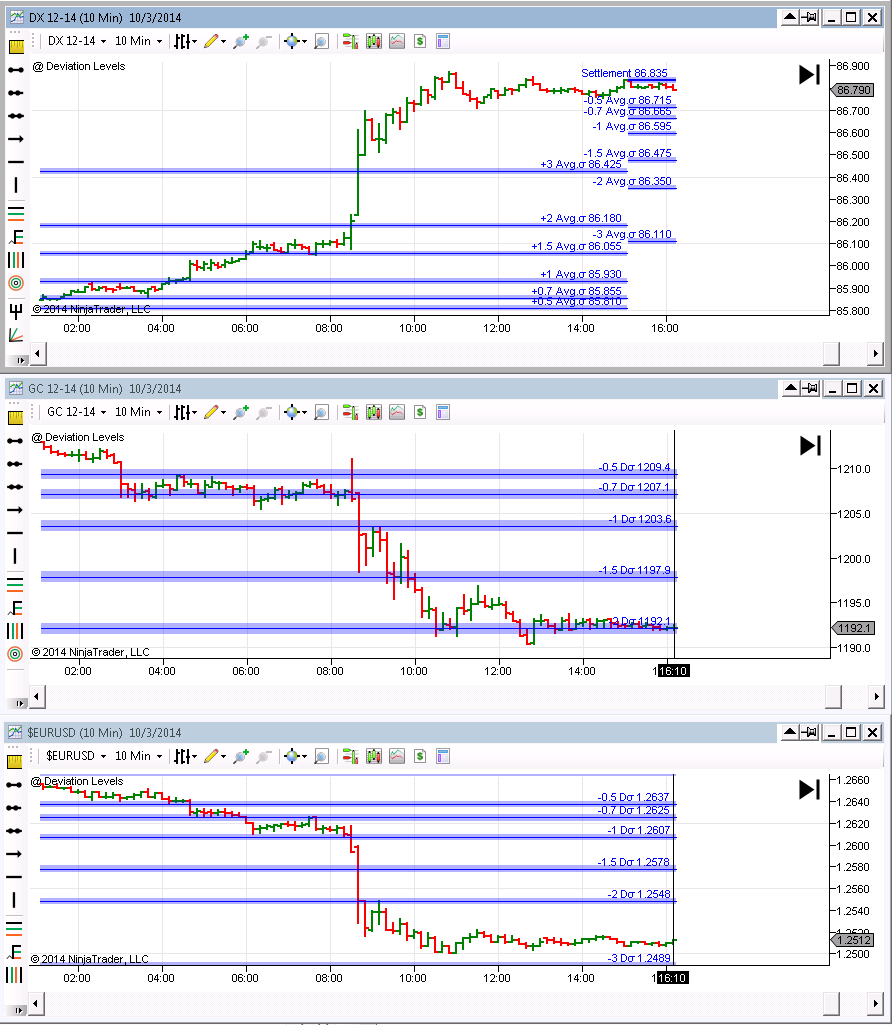
Another correlation to the DX can be made with Forex pairs. If the pair’s base currency is US Dollars, (when the US Dollar is named first in the pair like USD/JPY or USD/CAD), then often they will move similar with the DX. When the base currency is not the US Dollar, then that Forex pair can move inversely to the DX. The correlation and the edge for trading come when you see the inverse or mirror action between markets and the DX
Like many correlations, just because there is a correlation does not mean automatic causation. There can be many other variables that influence results. For example, just because you eat candy does not guarantee you’re going to get cavities or that the candy is the only thing determining you’re getting cavities. The cavities could be from other foods and not brushing well. Back to trading, the same is true with the DX and the markets. There are other variables that move the markets. For some time now quantitative easing, the purchasing of Treasury and mortgage debt to spur economic recovery by suppressing long-term interest rates, has been in place to protect the economy. As interest rates were kept low to keep the economy stable, stock values rose, therefore the indices rose as well. So, in this case, while the DX was rising, often the indices were also rising for other reasons and no correlation was taking place there.
The key to trading is to look for a possible edge daily and during trading throughout the day. Here are a few tips while looking out for market correlation. Watch the DX alongside the markets you trade. Throughout the day if you start to notice the DX making significant moves or moves with momentum, then check out the indices, GC, CL and the USD pairs like EUR/USD, AUD/USD, GBP/USD. If they are moving inversely to the DX, then that can be your confirmation along with other indications you may have that it’s time to enter, exit, or tighten stops. Correlation shouldn’t be used alone as a singular indicator but like other indicators, it should be used as a second or third sign or indicator of a market making a move in a certain direction. You can trade Nadex spreads and binaries while following correlations. Using spreads and binaries are a great way to start out day trading in small amounts and be able to know what your limited risk is up front. Other correlations to watch for are JPY pairs or USD pairs all moving together.
If you want to see a strong visual of correlation, you can take the bars of one market and place them right on top of the bars of another market. Then, watch and get a feel for how they correlate to each other. Look to see which one tends to move first and lead the other.
If you’d like to learn more on how to day trade go to www.apexinvesting.com. Apex Investing Institute offers free education and free access to the Nadex Binary and Spread Scanner Analyzers. Member traders are invited to trade in the rooms, take advantage of trade signal services, have key indicators and access the Apex Forum. The forum content is up to the minute and includes over 8000 members. In a supportive learning community of seasoned as well as up and coming traders, traders of all levels learn how to trade Nadex binaries and spreads in depth, as well as futures, Forex, stock and options, and gain an edge for successful trading overall.