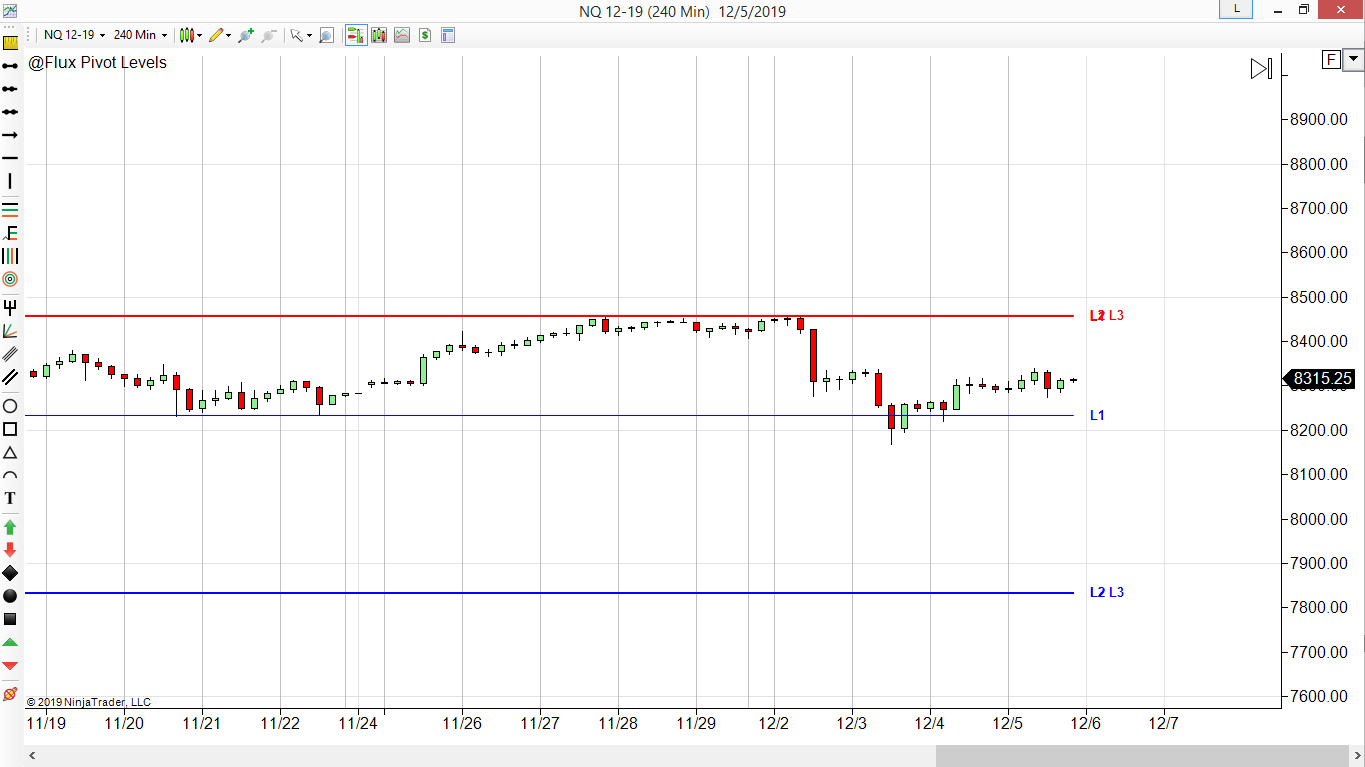
Hi, I’m setting flux levels, but have no idea where I should draw the solid blue lines. Here are some screen shots of the charts. You’ll see that the L1,L2,L3 overlap in places. Should I just draw one line to represent where there are multiple lines? That’s the conclusion I’ve reached, but I’m not sure