By Darrell Martin
Consumer spending drives most, if not all, western economies. Not all retail sales are alike, however. Car sales can make up 20% of retail sales and tend to be volatile or inconsistent. Because of this, they are not included in a Core Retail Sales news report. Statistics Canada will release both the Retail Sales and Core Retail Sales news for Canada at 8:30 AM ET, Wednesday, February 22. Traders follow this monthly scheduled news event for the impact on the markets and trading opportunities.
Day traders can trade this news using an Iron Condor strategy for this event due to the typical market reaction to this news. The Iron Condor strategy can be set up using Nadex spreads, an option having capped risk, unlike trading their underlying markets. A spread is bought below where the market is, but with the ceiling of the spread where the market is trading. Another spread is sold above the market, but with the floor of the spread where the market is trading. The strategy is set for making profit after the market makes its reactionary move to the news and then pulls back.
Each Nadex USD/CAD spread for this trade should have a profit potential of $15 or more. When the market pulls back after having gone long or short, and it is somewhere close to where it was when it started for both the short spread and the long spread, it will make some profit. Entry can be as early as 8:00 AM ET for the 10:00 AM ET expiration spreads.
The market needs to either stay between the breakeven points or after having made its move, pull back to between the breakeven points. For this trade, with a combined profit potential of $30 or more, the trade is breakeven when the market is at 30 pips above or below from where it was at entry.
What if the market takes off in response to the news but doesn’t pull back? Then stops are needed to keep risk to a 1:1 risk reward ratio. Those points would be 60 pips above or below where the market was at entry.
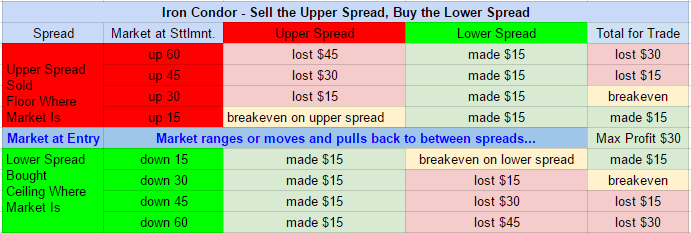
To see a visual of how the trade profits in relation to the moves of the market, see the diagram below. The profit and loss scenario can be seen for each of the spreads and then combined at settlement.
Free day trading education and free access to the spread scanner is available at www.apexinvesting.com.
