By Darrell Martin
Chances are there is not a new thing happening at bars that has anything to do with timestamps, but you must admit is makes for a catchy title!
If you have traded for any amount of time, you have probably had a situation when you were sure that your trade settled In The Money (ITM) only to find out that it did not. You may have become upset or irate, even feeling like you had been screwed! This is where the importance of understanding bar timestamps comes into play and it has to do with charts, not drinking establishments!
Different platforms plot their timestamps differently. There is no hard and fast rule that says they must adhere to a given way of plotting. In fact, it may be as simple as a personal setting that is set by the user of the platform. For this discussion, however, let’s examine the different ways they can be plotted.
How Do Charts Plot Their Data?
The chart below is from the Thinkorswim platform and shows a one-hour chart of oil with the current timestamp of 12:00 as the open of the bar. It is showing that the actual time is 12:12 and it is lining up with Eastern Time.
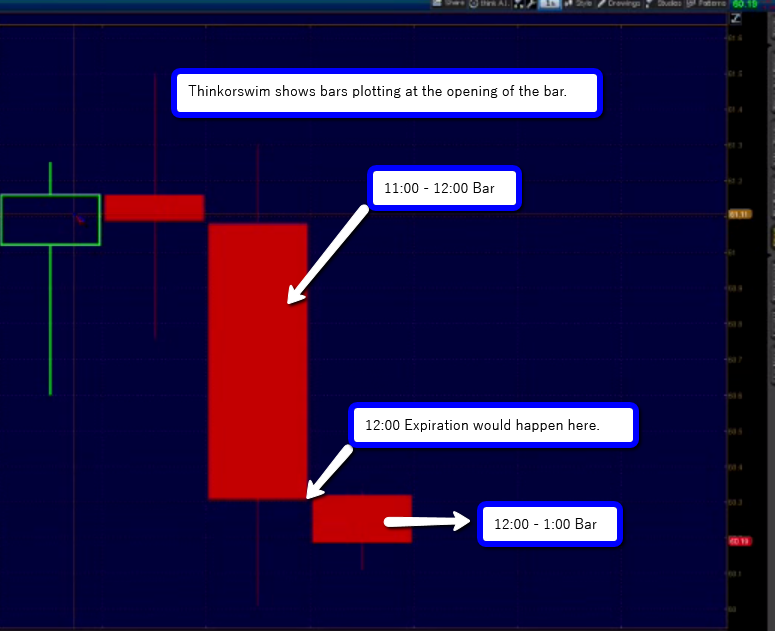
Why does it matter if it shows the plotting as the open or the close of the bar? If you think about it, it can make a world of difference to your current trade. Let’s suppose you are in a trade and watching a chart not realizing that it is plotting according to the opening. You are all excited, planning what you will do with the money you are earning from this trade that you suppose is settling in the money, and then it does not settle in the money. Why? Because you were looking at the wrong bar. On a one-hour chart on thinkorswim, it gives you the timestamp of the opening of the bar.
Plug In Some Numbers For Clarification
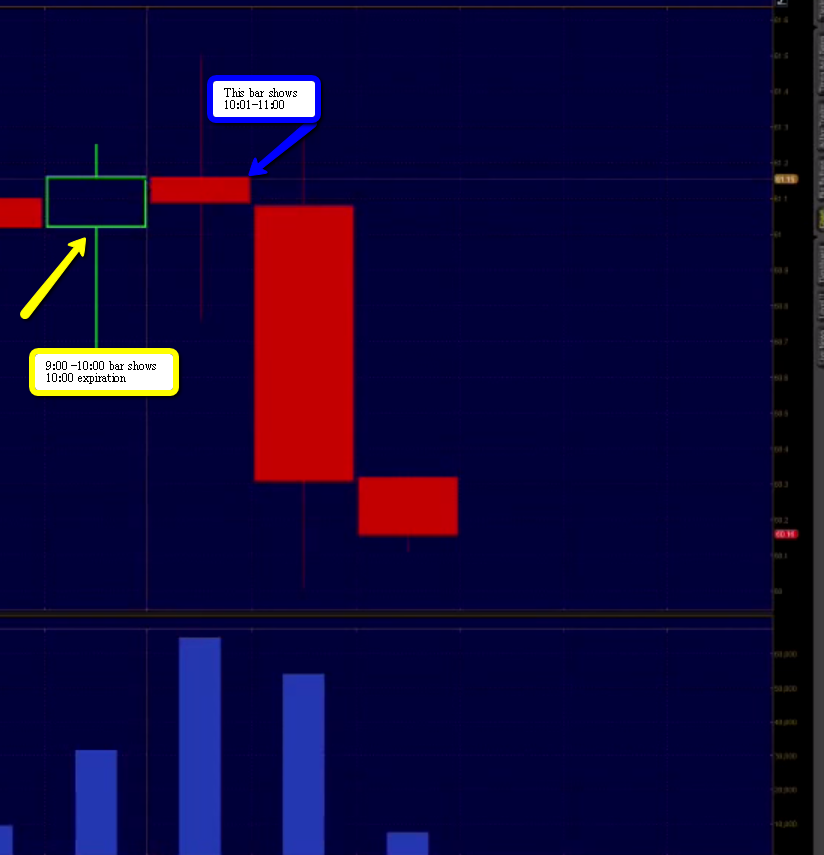
It usually helps in understanding a concept if some numbers are put into an example to make it real. Let’s say that you sold the 10:00 AM expiration. Your strike is 81.15. In looking at your chart, it says at 10:00 the market closed at 81.08 which would make your trade profitable. However, Nadex says that it expired at 81.17. You are furious! Who is jerking around with the prices and why do the ticks on the charts not agree with the settlement prices?
The reason is that the bar you are looking at is for 10:00-11:00.The close of this bar is representative of 11:00. You want to see the representation of the 10:00 expiration. In order to do that, you need to look at the close of the 9:00 AM bar.
Contrasting this plotting on the opening of the bar, is NinjaTrader, who plots the closing time. This can be especially important to you if you are trading anything that focuses on the expiration times. On a Ninja Trader chart, you would be looking at the bar as it is forming because it will plot its timestamp according to the closing time.
If you don’t understand the difference of how the platform you are using plots its charts, you can think there is a massive discrepancy because you don’t know that you are looking at a timestamp of an open versus the timestamp of a close.
Still Confused?
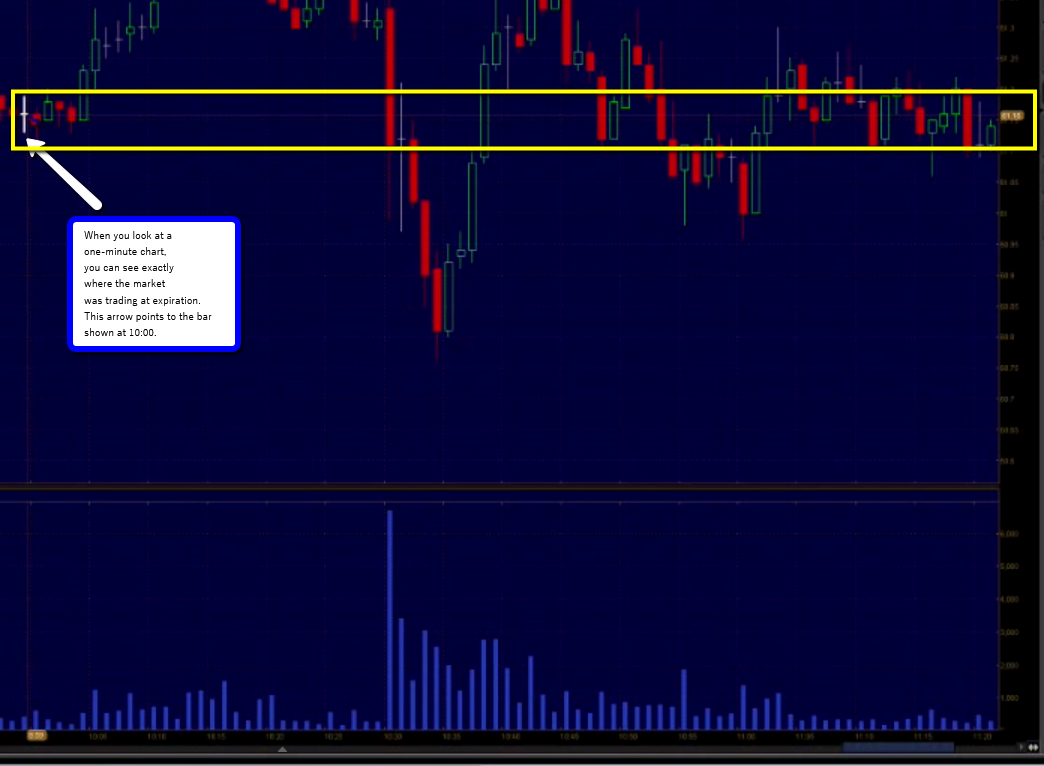
As confusing as this may be, you can always break it down. Instead of focusing on a one-hour chart, go in and look at a one-minute chart. This will allow you to see exactly what is happening during that hour. It also helps you pinpoint where the market was trading at expiration on any of your current trades. The chart below shows how a one-minute chart can clarify expiration times.
Bar timestamps obviously have nothing to do with your favorite drinks, but knowing there is a difference in how they apply to your charts, can help you make more informed trading decisions.
You can watch a video with more information on Bar timestamps and settlements. Click HERE.
To further your trading education, please visit www.apexinvesting.com.
