well…no one yelled at me yet so…think I will still post ![]() PEACE
PEACE
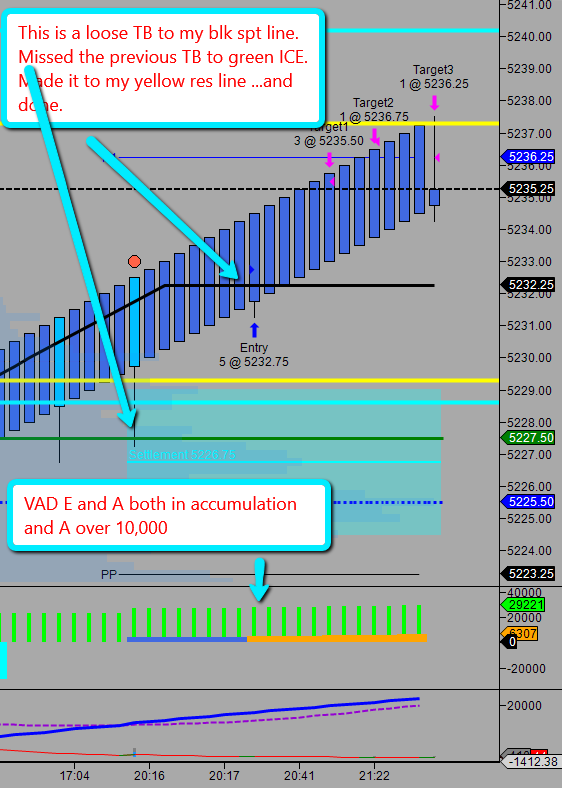
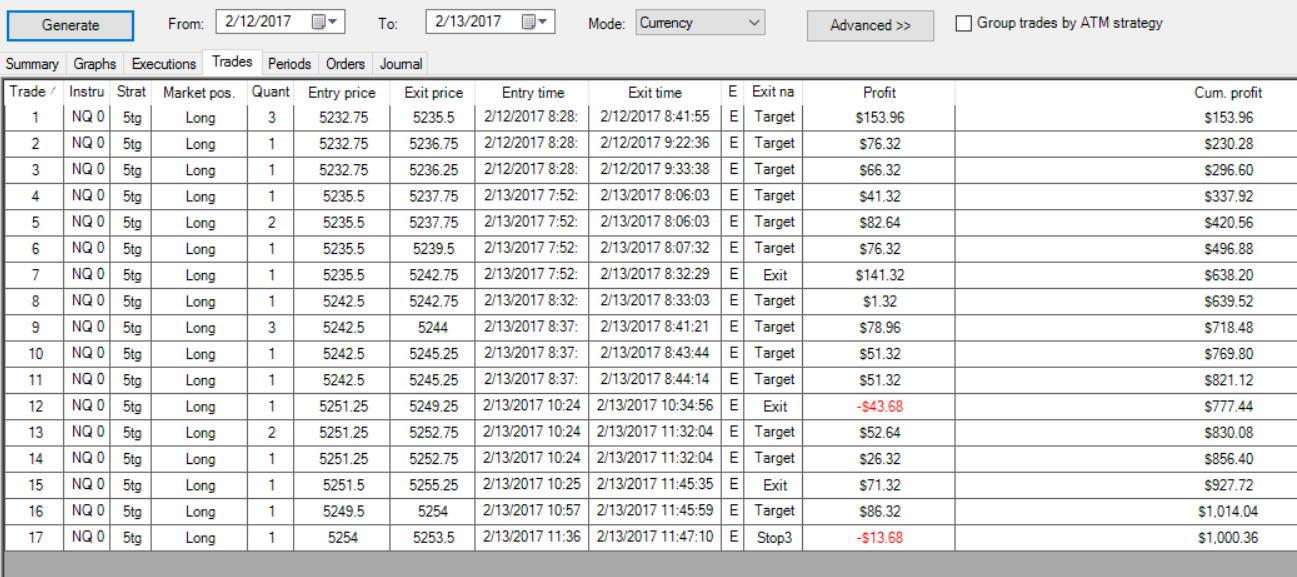
8:49am and I’m done. below I included last nights Globex snack on the control panel (transparency ![]() ) Same sort of trades a pull back forming a wick. Even though the wick did not come down to a support line, it was above my black support line.
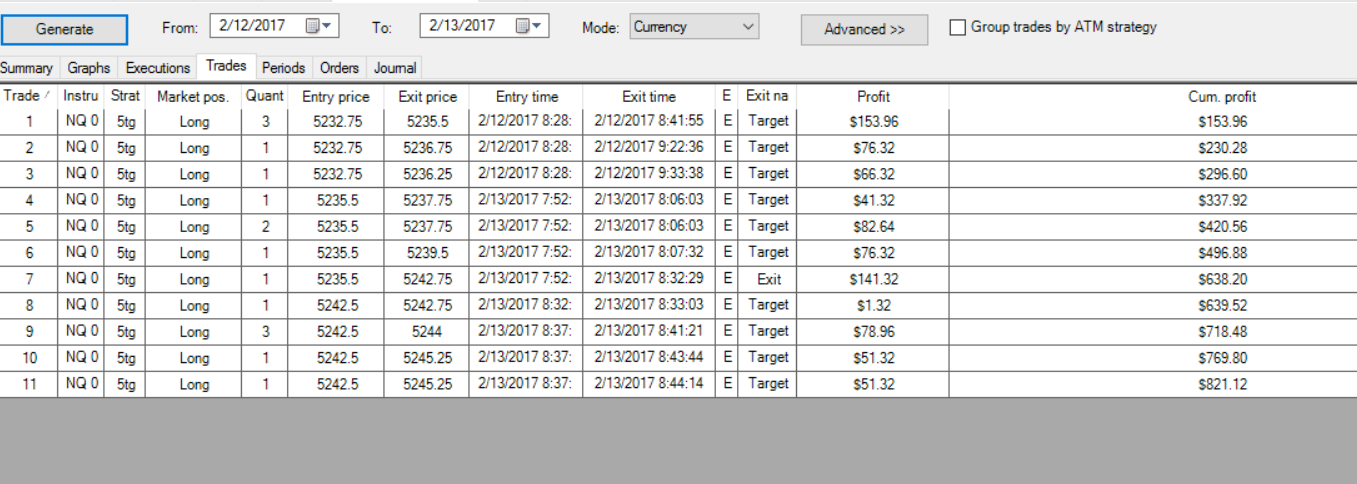
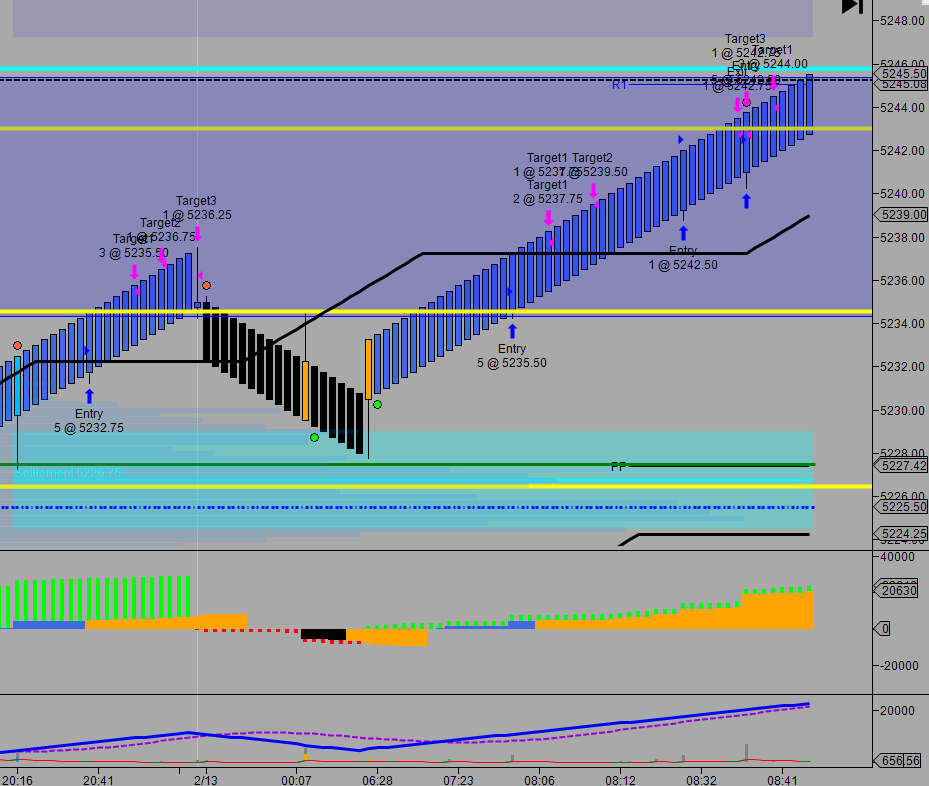
Neither VADs were over 10,000 but both were strong numbers. The second entry this morning @42.5 had both VADS over 10,000. The only difference in the chart below and the one above is, I recalculate my yellow and aqua spt/res lines after midnight (so they moved)
) Same sort of trades a pull back forming a wick. Even though the wick did not come down to a support line, it was above my black support line.
Neither VADs were over 10,000 but both were strong numbers. The second entry this morning @42.5 had both VADS over 10,000. The only difference in the chart below and the one above is, I recalculate my yellow and aqua spt/res lines after midnight (so they moved)
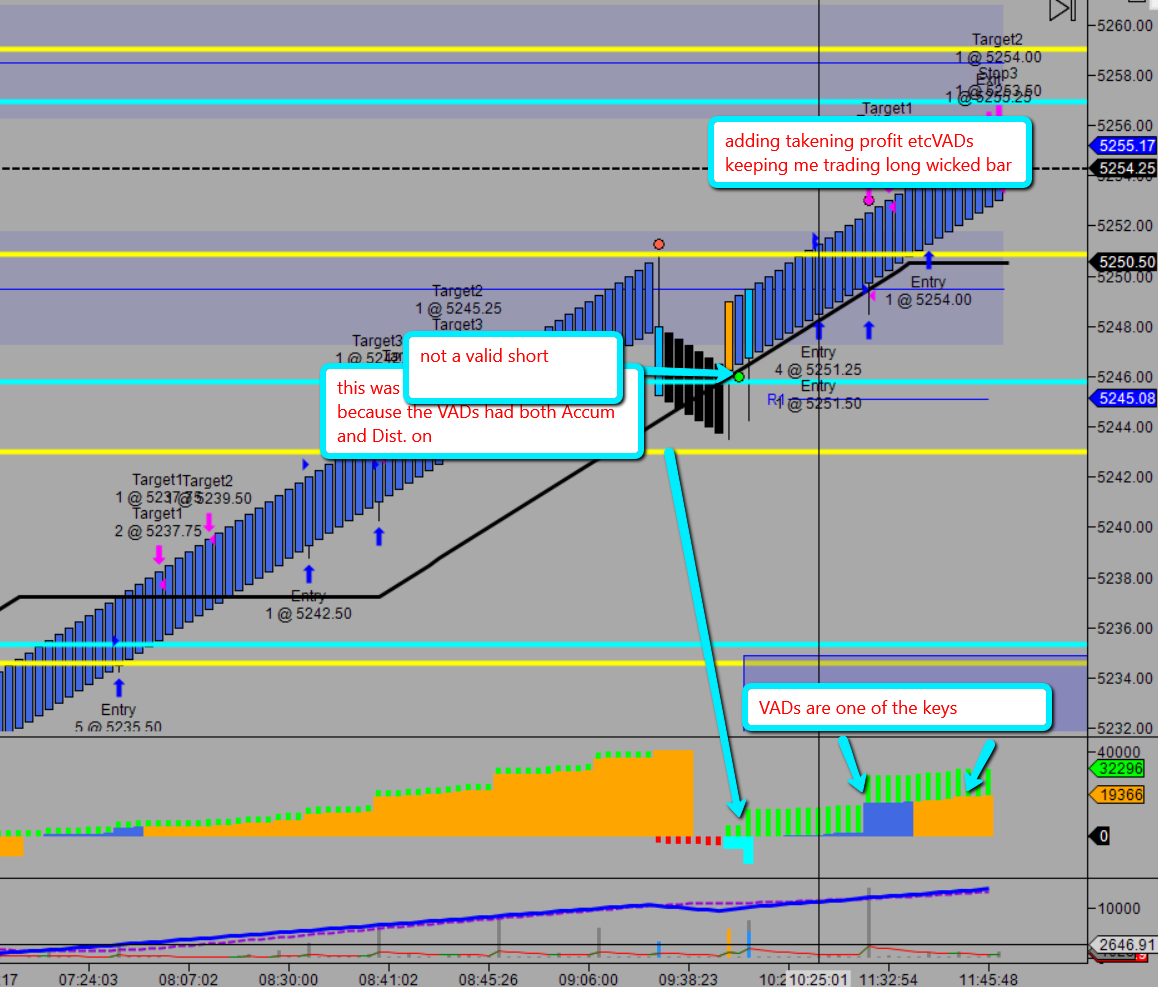
Ok,this has been just a little insight in a day of how I use APEX and my system Make it your own and use those VADS…PEACE
Very nice!
Yes Very nice!
Its interesting to see how you use such small trend tick size and a large open offset on your Diagnostic bars. It will definitely take the noise out of the trend and allow you to see the bigger pullbacks and the bounces off important levels. Like you said, its all in the sling! This is not how I like to see the price movement, but its working for you. Your other indicators must really give you confidence in those slings 
Thanks, the main indicator I use is the yellow and aqua sup/res lines. It is a method I have developed and once calculated they are good until 11pm cst. I usually do the calculation and draw new lines a couple of hours b4 RTH (they are not fibs…I never could decide which one of those lines I wanted…LOL). Been looking for a good programmer to write the code so I don’t have to manually do them.(getting lazy I guess). The black line is something I have tweaked as well over the years and based on my old Ichimoku trading system. Knowing where price is in relation to this line is also the key. There are a few extra things to look for in the bar itself but putting it together with some APEX stuff makes the conformation pretty easy. I also use 2 other diag bar setting charts and one of my original non-time based chart. The one I post is the smaller one I pull the trigger on.
1 Like
