VAD is an indicator that has proven to be a powerful tool when it comes to reading the flow of volume in the markets. Volume is the driving force! Price goes to where the orders are. When those orders are taken out of the market, price then finds the next group of orders. Combining the APEX Elite pattern and the VAD indicator, we get the best of both worlds. The APEX Elite pattern visually shows us the flow of the market. The market has a tendency to make a move in a particular direction and then pull back to hit stops or fill orders that were missed before continuing in the original direction. When combined with divergence in volume on the pullbacks using VAD, the overall picture of whats happening in the market becomes extremely clear. Orders are being taken out in one direction and then goes the opposite way.
Correct Setups
In the chart below, it’s very clear of whats happening when there’s confluence between the two indicators. Both signal clear direction of trade that should be taken based on market pullbacks and volume divergence. Orders are being taken out on the pullbacks before continuing in their original direction.
NOTE: The first Apex pattern that is formed in an opposite direction is not a valid pattern. Must wait for second pattern to form.

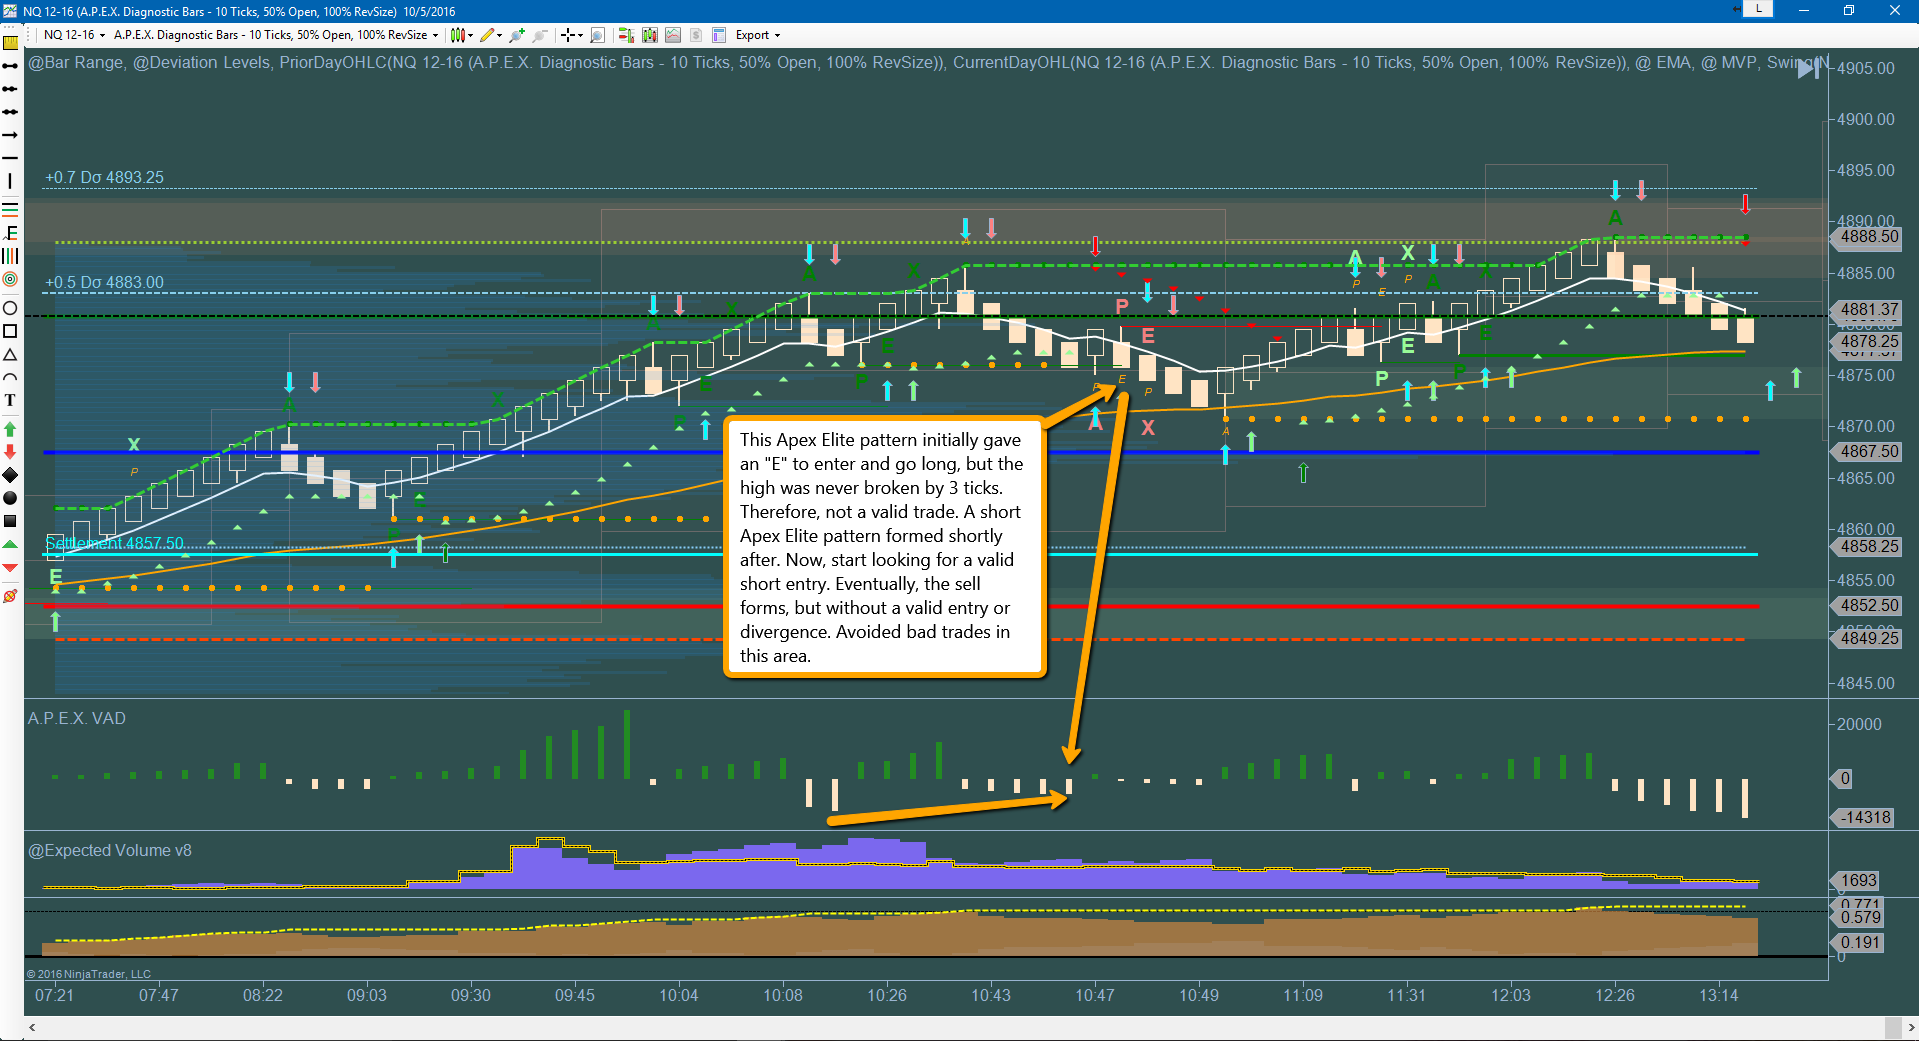
Bad Setups
Sometimes the market likes to make one more push in its original direction before reversing. Think of it as “trapping traders”. Traditionally, traders are taught to buy/sell the support/resistance levels or swing highs and lows. The APEX Elite pattern helps by filtering out bad trades from the good ones. In the example below this is shown. The market tried one more time to continue in it’s original direction off of a swing low, but the Elite Pattern filtered out the trade. If the rules of the pattern are followed (enter 3 ticks above/below the E), there should be no problem avoiding bad trades.
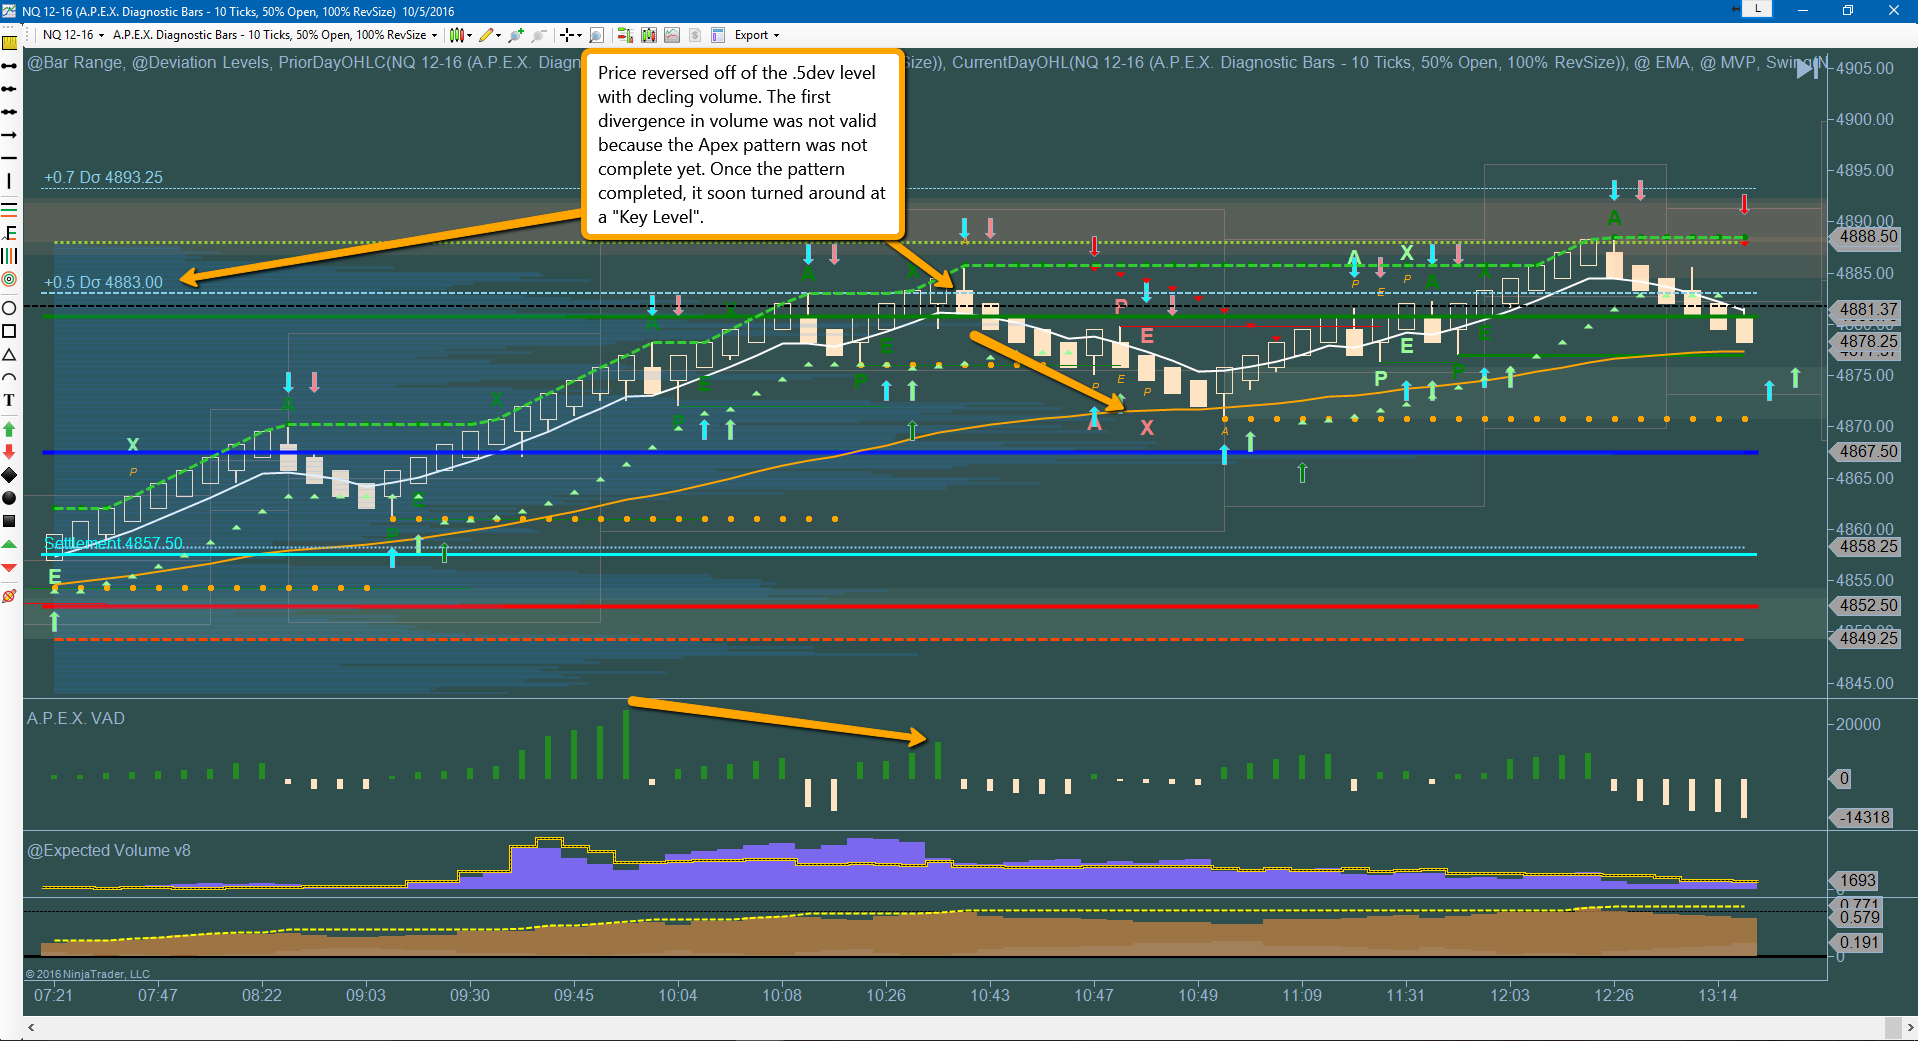
Setups to Watch For
When markets are in a strong trend, it can be hard to decide when and where it might end. This is where VAD becomes very handy. By reading the flow of volume, it can be easy to determine when the momentum is slowing down and price is about to reverse. Remember, always be aware of where the orders are. These areas would include Deviation levels, ICE levels, magnets, mini magnets, ZOI’s, etc. When price reaches these levels, always be aware of how volume has been “accumulated and distributed” within the trend that took place before it reached the level. In the example below, Volume slowly declined as the trend went up. It was clear that the trend was coming to an end. And where did the trend end? At a deviation level! A key level in the market.
It's obvious APEX has the best tools to trade with. Like Darrell says, the indicators are the ABC's. We as traders have to learn the 123's. This post was to help understand those 123's. An understanding of how the market works is essential to being a profitable trader. These indicators make it very easy to apply that knowledge and visually see it happening in real time. Like always, demo until it's fully understood and then apply it to live trading. Hope this helps!
