By Darrell Martin
The US Bureau of Labor Statistics or the Department of Labor will release several reports on Thursday, January 11, at 8:30 AM, EST. These vary in importance from low to high and include the following:
-
Core PPI (MoM)
-
Core PPI (YoY)
-
PPI (YoY)
-
Initial Jobless Claims
-
Continuing Jobless Claims
-
Jobless Claims 4-Week Average
The Producer Price Index (PPI) is a leading indicator of consumer price inflation since it measures the change in the prices of things sold by manufacturers. This accounts for most of the overall inflation. Reports will include both year over year and month over month. If the report released is higher than was expected, consider it positive or bullish for the USD. If it is lower, then it should be regarded as negative or bearish for the USD.
Core PPI excludes food and energy. It measures the change in the selling price of services and goods sold by producers. If producers have to pay more for the goods and services they receive, that increase in price is usually passed on to the consumer. Thus, this causes the PPI to be a leading indicator of consumer inflation.
The difference between the three jobless claims reports is the initial jobless claim measures those who file for unemployment for the first time during the past week. Continuing jobless claims are those individuals who qualify for benefits again; it isn’t their first time to file. Since the week-to-week numbers of those filing for benefits can be very volatile, the four-week jobless claim is a moving average that smooths out the weekly data. It is used for the initial jobless claims metric.
If any of these reports release higher than expected readings, they should be taken as negative or bearish for the USD with a lower than expected reading being considered positive or bullish. Therefore, with all of these reports being released at the same time, there’s bound to be some movement in the market. How can a trader take advantage of it? A good strategy to utilize is the Iron Condor strategy using Nadex EUR/USD spreads. This is good when it is known that the market will move, but the direction is unknown and a pullback is probable.
Iron Condor Setup One spread is bought below the market while another spread is simultaneously sold above the market. The ceiling of the bought spread should meet the floor of the sold spread and be where the market is trading at the time of entry. This allows the market plenty of room to move and pullback to make a potential profit. With Nadex spreads, risk and profit is capped at the top and bottom of the range of the spread.
When the market pulls back to center between the two spreads, after having made its reactionary move to the news, is where each of the spreads will make max profit.
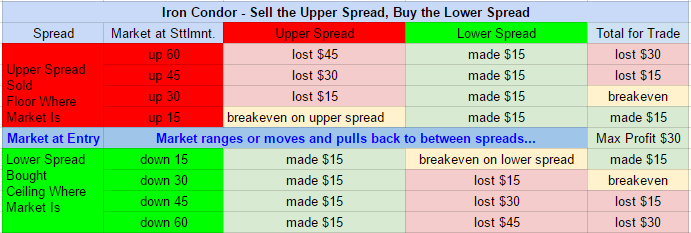
Both the bought and sold spreads should each have $17 or more profit potential when entering, for a combined $35 or more for the trade. With these numbers, if the market settles anywhere between the break even points of 35 pips above and below, then there is some profit made. In the event the market takes off and doesn’t pull back, then stops are set up. The 1:1 risk reward ratio points are where the market would hit 70 pips above and below from where it started.
Entry can be as early as 8:00 AM ET, when the 10:00 AM ET expiring spreads are posted for trading. Stops should be placed right after entering the trade. If there are no spreads available with $17 or more profit potential, then there is no trade. Never force a trade. Always be patient for the best trade setup. To understand how each of the spreads profit or lose, based on every 15 pips of market movement, see the below image.
Free day trading education and access to a community of supportive traders helping traders, visit www.apexinvesting.com.
