Side note added by Darrell - the course is now posted here: http://apexinvesting.net/boomerangbinarytradingsystem/
Would it be possible for someone to explain the Boomerang rules for this chart and step by step?


Side note added by Darrell - the course is now posted here: http://apexinvesting.net/boomerangbinarytradingsystem/
Would it be possible for someone to explain the Boomerang rules for this chart and step by step?

Summary of Rules Above
UPGRADE FOR ALL CROSSES OF GBP JPY USD CHF CAD EUR AUD AND NZD ON EXPECTED VOLUME IS COMPLETE)
Each letter is a trade (a, b, c, d) Each trade has steps (1,2,3,4) Each Boomerang has a unique color for the Phase type, P1, P2 or P3
Yellow P1 Launch Red P2 Reversal Blue P3 Continuation
NOTE: For your chart setup we recommend using gold, blue, or black bars, but not alternating color bars like red or green. A colored red or green doji bar should not influence you, as a doji bar is not a clear up or down close bar.
A doji bar is a bar that has a couple of ticks between open and close or less, and has near equal wicks on each side, or a bar that closes and opens at the same price. The idea is for a down close bar to be a bar where the bears clearly won. An up close bar is a bar where the bulls clearly won.
NOTE: Very important, we recommend you use the stop trigger plugin on the scanner. The stop trigger plugin will enter into the trade at the right time, when the Nadex indicative index hits the trigger price you want, and not just when the chart hits it. The Nadex indicative index number comes from, and is figured from, multiple trades/quotes at that level. This will help you avoid many false entries and stops based on your just looking at the chart, and not seeing where the Nadex indicative number is. In short it will help keep more in your pocket. (Don’t get to this later, learn how to use it today). When you open a ticket from the scanner, in the upper right corner click on “Use Stop Trigger Function†and the stop trigger function ticket will open. There are videos and write ups in the forum on it.
NOTE: Patience: “I would always wish i have something I don’t as I have something I wish I didn’t”. This was taught to me by my mentors over the years. Be patient don’t force the trade. Let the setups come to you, then don’t hesitate to strike.
NOTE: Successful traders are more afraid of losing money from mistakes and ignorance than they are of looking bad in a chat room. I promise you will make 100’s of mistakes. If you are not in the Nadex trading pit chat room… you are costing yourself 100’s of dollars, countless hours and tons of frustration. You may just quit as you think it doesn’t work yet, you don’t even know if you know how it works, as you never asked anyone if your understanding is correct. You have to be engaged in the community, post your trades, post your charts. Decide why you are here to look good or to make money. You don’t know what you don’t know, until someone who does know, tells you. And they can’t tell you if you don’t post your trades and your charts. Don’t say, I’m too new. I don’t want someone to follow my trade and lose. Bull … we are all big boys and girls here, and we can all look at our own charts to see if any trade posted is a good idea or not. If we don’t know we ask questions. If it’s wrong we help the other trader learn why. If it’s right we take it and give ‘em kudos. If you’re not posting within 72 hours or less, you’re only hurting yourself. If you ask questions you will be here months from now, years from now, if not you won’t last days or weeks. Most cancellations I receive have never posted in our rooms or submitted a help desk ticket or ever posted in the forum. Maybe 1 or 2 posts or tickets, but not actively posting, asking and verifying if they are doing and seeing everything correctly. I want you to be successful so I’m just saying it like it is, get in there, get engaged, get the kinks worked out and help others to do the same. Traders helping traders! BIG TIP: Once you’re in a trade set your take profit, set your stop (if applicable), and then look for the next trade. ie you may get in a P1, then get a P2 or several P2s, then exit those P2s and then end up exiting the P1. Don’t stop looking for other P2s or a P3 or next hour P1 trades, just because you’re already in a trade.
P1 - Boomerang Launch (Yellow), a close OTM strike
TIPS:
A) Since P1’s happen so early in the hour, the ITM binary will move very slow making it difficult to take profit (gamma impact on delta etc… etc…). Long story short, choose a close OTM binary that you can set an easy take profit for at least $20+ and often for more. Expect it to move around a lot, but come back by expiration and take profit. Using the OTM removes the need for a stop loss which is important on P1’s.
B) P1 setups can actually occur early in the hour before the next hour i.e. in the last 12 mins of an hour with an entry in the last 8 mins of the hour, with a strike expiring in the next hour. Be on the look out for these as well (it will take some practice to start seeing them, but they are often great trades).
C) Note you cannot have a current hour P1 entry after a P2 HAS taken place. If a P2 has taken place then it could be a P3, see below for P3 rules.
D) You can only have one P1 per hour.
P2 - Boomerang Reversal (Red)
Simply put: “reversal bar- exceeds volume -bar breaks out”
Note: These trades can happen when the market is 150% outside of range as well, they don’t have to happen in the channels.
Reversal Bar is closing in opposite direction of trend of previous bar (Step 2 in red, on the chart) and is not a doji (see doji definition above).
Volume is exceeding expectations on the Reversal Bar OR Setup Bar by at least 1 contract or more (Step 3 in red, on the chart).
NOTE: One exception to this rule is when, a strong selloff happens before the reversal bar, going into the expected range high/low. The bounce can be expected and an entry can be taken. In this case, make sure the range has reached 75% or more, the reversal bar is closing in the opposite direction of trend of previous bar, the volume on the PREVIOUS BAR has exceeded expectations, but the volume on the reversal bar does not have to meet or exceed expectations.
For example look at trade D above. The bar before the reversal bar exceeded expectations (the big up bar). Then the reversal bar’s volume was right at/over expectations. Assume for a moment that the reversal bar’s actual volume was less than expectations. It would still be a valid trade since the preceding bar’s actual volume exceeded expectations, and was well past the 75% of actual high to low mark. Again this may take a little longer to learn and easily spot but you can add it in over time.
NOTE: During lower volatility hours one can also look at entering these trades, (ONLY when volume confirms exceeding expectations, and you have not already hit the 75% mark of expected range high to low).
VERY IMPORTANT - be sure to use the stop trigger function to enter at the right time based on the Nadex indicative index number and not based on just the chart. See note at the top.
NOTE: If you wait to enter 2 bars or 3 bars after the reversal bar, then the momentum is gone and much of the premium will be gone, making it a higher risk trade. Its not the way to trade the system.
TIPS:
A) Most boom reversals are ATM trades. Meaning they are slightly ITM, or if necessary slightly OTM. You should have no problem getting fills on these trades most of the time (except for a massive market move). At a minimum try for $20 to $25 profit, ideally $30 to $40 profit.
B) You can repeat this P2 over and over and over again, sometimes 2-4 times in an hour.
C) Stops can often be the opposing side of the reversal bar, or the extreme before the reversal bar if the bar before the reversal bar made a higher high or lower low. Yes the loss will be more, but that is the reason for getting more aggressive on the strikes, so the profit will be higher as well.
NOTE: Important
Classic Boomerang ITM
It does not include steps 2, 3, or 4 above in the reversal. It is simply if the market reaches 75% of the expected high to low range, to take a binary trade in the opposite direction. Using the strike that is at the extreme of the expected high to low range, i.e. if the high to low range is 20 ticks, then you use the ruler on the toolbar to measure what price 20 ticks from the high is on the chart. Then when the 75% alert goes off, use that price to choose your ITM strike. You don’t wait on volume you don’t wait on reversal bars. You don’t wait on breakouts. You will get more trades this way. You will catch a lot of extra wins this way. But due to the lack of confirmation, you will also catch of lot of extra losers. Using the P1, P2, P3 (P3 is below) boomerangs you can easily get 10-12 trades on almost any single trading instrument within an 8 hour session. Do multiple instruments and you can simply multiply it. There is no reason to push it.
Classic Boomerang OTM Sub System (Don’t do these on high impact news days).
When the market hits the 75% mark of high to low of channel, buy a binary for ideally $15 no more than $30 at a strike that is at or below the close to close channel. Then take profit either A, when strike is hit for $15 to $30 profit, (this would be once your limit sell set to take profit at $45 fills), or B trail your stop (this takes a lot of experience don’t try it to begin with).
Or if selling sell for $85 and no less than $70, at a strike, that is at or above the close to close channel. Then take profit either A, when strike is hit for $15-$30 profit, (this would be once your limit buy set to take profit at $55 fills), or B Trail your stop (this takes a lot of experience don’t try it to begin with).
Advantages are low risk, 100 to 200% profit and no stop losses. It is often repeatable within the same hour. Disadvantage is no confirmation, so get ready to get hit more often. However profit can more than make up for it, if you can take it enough to take them all hour, for hour after hour, day after day win lose and let the profitability win out.
P3 - Boomerang Continuation (Blue)
NOTE: P3 Continuation trades are rare. Usually, they are seen after P2 trades. The majority of the time we see a p3 happen earlier than a p2 is when news happens. But when a p2 trade looses and a p3 trade is triggered it can easily more than cover a p2 loss. For a P3 you want to see a lot of volume confirming momentum, as you are really stating the market is going to “continue” to go way outside the range. However P3 trades are often better off served as a early P1 entry. See Tip B above under P1 Launch.
They are only entered when high to low range has been exceeded (Step 1 in blue, on chart), The entry (ideally the close of the bar but not required), is outside the high to low plotted channels.
Volume must exceed expectations (Step 2 in blue, on chart)
They are entered in the direction of the bar close
Entry takes place when the following bar breaks the bars high (if long) or when the following bar breaks the bars low (if short).
TIPS:
A) P3 trades if used for current expiration should be using an OTM strike or a Double Binary (ie buy a ITM and buy an OTM or vice versa). These are your BIG profit trades. Go for large profits on these trades.
B) P3 trades if used as a P1 should be using an OTM strike. See P1 Launch.
News Trade Boomerangs
Do not be in a boomerang before news comes out. ie news comes out at 15 or 30 minutes into the hour do not enter.
After the news you can enter but be ready to act FAST
News is the one exception where you can enter a P3 before a P2 happens.
Example from today after the FOMC minutes: 04.09.2014-15.16.04 - ApexInvesting’s library http://screencast.com/t/eoSwIVDk0ks
Ya Same here DM. The rules were just what I needed. I’m a guy who loves documentation. 
Now that will save me some $$$ !!
Update this setting in NT7 to ensure your expected movements and volume are working properly.
Tools - Options - Data
Change to Merge To Back Adjusted
TOP OF HOUR RANGE BUTTERFLY OR IRON CONDOR
This could be done on 60 minute, 120 minute, ie 391 min on corn/soybeans, or daily 1440 etc…
Putting a limit to buy a strike below the low channel for 85 and a limit to sell a strike above the high channel for 85. Sometimes both will get filled. Usually one will get filled. In all cases exit if the market hits the strike (or if strike is beyond the range if market breaks the high/low of the range by a tick using stop trigger
Can i hedge a boomerang: Hedging idea to play with: 1) entering a hedge higher or lower at much lower risk and exiting when profit is enough to cover loss and its past the “traditional” stop loss (will lower profit) (ie buy cheap otm when about to sell a ITM or sell a cheap OTM when about to buy a ITM
entering early when moving in a direction and giving up say $5.00 knowing you may not be filled and will give up $5.00 of your profit if you are filled (ie buy cheap otm when about to sell a ITM or sell a cheap OTM when about to buy a ITM
Risky but martingaleing as it goes against you as rarely does it go much against you (layering in at higher and higher or lower and lower binaries as it moves down/up) Another tip is going back to news days where NFP is coming out the next morning and seeing what happens at night before news on specific instruments like uj eu gu au also how do instruments act the day of after the event - and for like today with a gu and eu release seeing how all instruments react night before and day of the event to see if some “behave”/“stay in the ER” better than others. I don’t’ recommend the martingale system - its high risk and requires large account and you have to be really in on your risk management ie 5%/6 is risk on trade to even attempt this.
Excellent example of the Exception of High Volume ON the reversal bar on P2, Reversal Bar Low Volume

reading volume and price action (close in relation to the previous bar) seems like the keys to success? I am working hard to master this, I am determined to be a success at this! Thank you Darrell and team for all your sharing of knowledge. I feel like I am becoming a better trader by the day!
The video course is now posted here: http://apexinvesting.net/boomerangbinarytradingsystem/ also under the education, elite and signal menu above. Each piece is its own lesson with a quiz. It will track and remember your progress for you and you will get a certificate of completion after you have completed every lesson.
We will be making more and more future courses like this.
[quote=texas1876]Side note added by Darrell - the course is now posted here: http://apexinvesting.net/boomerangbinarytradingsystem/ [/quote]
Thank you. I was wondering where the videos were.
Before watching the videos it already looks like it’s well structured; i like the quizes… i’ll just keep watching them over and over if i don’t ace the test the first time.
Someone in the general section asked a great question (best strategy to learn first?). I’m glad he asked it because i don’t think i would have ran into it anytime soon and i like the praise i read people give it while looking it up because it helped learn essentials necessary for successful trading.
http://s1032.photobucket.com/user/juyhhjlelekejrj/media/Boomerang4.png.html][img]http://i1032.photobucket.com/albums/a410/juyhhjlelekejrj/Boomerang4.png[/img
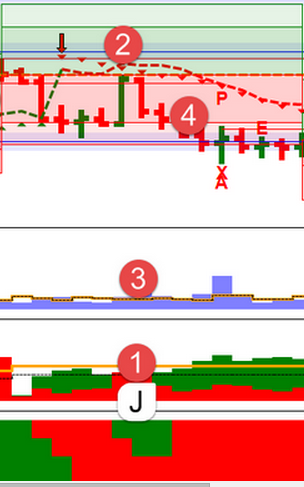
Darrell, Can you explain this. I have two questions should we go long or short on this reversal? Since the reversal bar is green I would think we would go long if the bar after the reversal bar exceeded by 1 tick yet I don’t see this on the chart. Also, what is 4 on this? I don’t see how that relates to anything.
1 = 75% of expected range 2= reversal bar 3 = looks like reversal bar exceeds expected volume 4 = ???
It appears the bar after the reversal bar did NOT exceed the reversal bar by 1 tick higher so why would there be an entry (4) in the first place? If there was an entry wouldn’t it have needed to have been a long entry since the reversal bar was an up bar?
Darrell,
It appears that on a long term basis, the discipline to refrain from a trade that is not fully set up is as important as striking when the iron is hot sort of speak.
Michael390
Wait till the trade is ready and when it is nail it without hesitation. You are right discipline is on the refraining and the trading both sides.
[quote=mikebeth49]Darrell,
It appears that on a long term basis, the discipline to refrain from a trade that is not fully set up is as important as striking when the iron is hot sort of speak.
Michael390[/quote]
You go short. (correct it did not break the high it is not a long)
Look at 1 (its a low to high retracement its red meaning go short) It moved up 75% plus from the low 2 is for the down bar that is the opposite of the bar before it (reversal bar) 3 yes it exceeded expected volume 4 - bar broke the low of the reversal bar going short
[quote=texas1876] http://s1032.photobucket.com/user/juyhhjlelekejrj/media/Boomerang4.png.html][img]http://i1032.photobucket.com/albums/a410/juyhhjlelekejrj/Boomerang4.png[/img
Darrell, Can you explain this. I have two questions should we go long or short on this reversal? Since the reversal bar is green I would think we would go long if the bar after the reversal bar exceeded by 1 tick yet I don’t see this on the chart. Also, what is 4 on this? I don’t see how that relates to anything.
1 = 75% of expected range 2= reversal bar 3 = looks like reversal bar exceeds expected volume 4 = ???
It appears the bar after the reversal bar did NOT exceed the reversal bar by 1 tick higher so why would there be an entry (4) in the first place? If there was an entry wouldn’t it have needed to have been a long entry since the reversal bar was an up bar?[/quote]
Thank you to Stephen for putting this together as a quick summary checklist on boomerang.
One addition is depending on pricing on P4 - you may do ETC Expiration Trend Collection - cheap OTM binaries that are SUPER close or both doing Double binaries - ITM to pay for OTM
If you get confused on on P2’s don’t zone in on 1 2 or 3 bars…
make sure to backup and look at the purpose of P2/Classic trades
The market moves up or down - and then pulls back (think about it most bars dont close on their highs or lows)
We are plotting a 1 hour time frame channel on the chart on p2 and classic trades (you could make it bigger or smaller etc…)
but within this we are trading the move up and then the reversal… reversals must reverse from the move itself…
Look at this chart - it shows 1 hour bars - with the channels on it (bar is on right side of channels) - you see the upper and lower channels - this is the expected range high to low from the close of the last bar. You see the darker inside channel - this is the excpected close to close - or rather the close of the last bar to the close of this bars expectations. Notice how often the market moves up or down but then closes right within that close to close channel. This is the whole basis of the P2/Classic trade. We use the 4 minute bars to see when to time the entry and obtain confirmation but don’t lose the perspective of the WHY we are doing the trade. Back up and see the hour (note you don’t need to plot the hourly chart the channels are doing it for you :))
NOTE as one trader calls it the ER P2 concept - basically you will only have a p2/classic when the ER histogram is in the same direction “color” as the reversal bar. ie red/down bar (Sell trade) - up long bar (buy trade)
