20 Min Binaries: Strangles
[Trading Live Volatile Markets with Nadex]
After viewing the NADEX webinar I need to know the following:
Are these the correct chart setting for the expected range indicator?
As far as I was able to tell this is what I saw on the tutorial.
Tutorial Video: Chart Settings
-
6 tick bar
-
@bar range
-
@deviations levels
-
@ Expected Vol (4min) or is it the V.8?
-
@ Expected Range (Hit to Low, 20 Min)
-
@ Expected Range (Close to Close 20 Min)
If there are any more please share.
Thanks!
You would want want to use Expected V8, but otherwise yes, looks like you got it 
1 Like
#skeltonmark
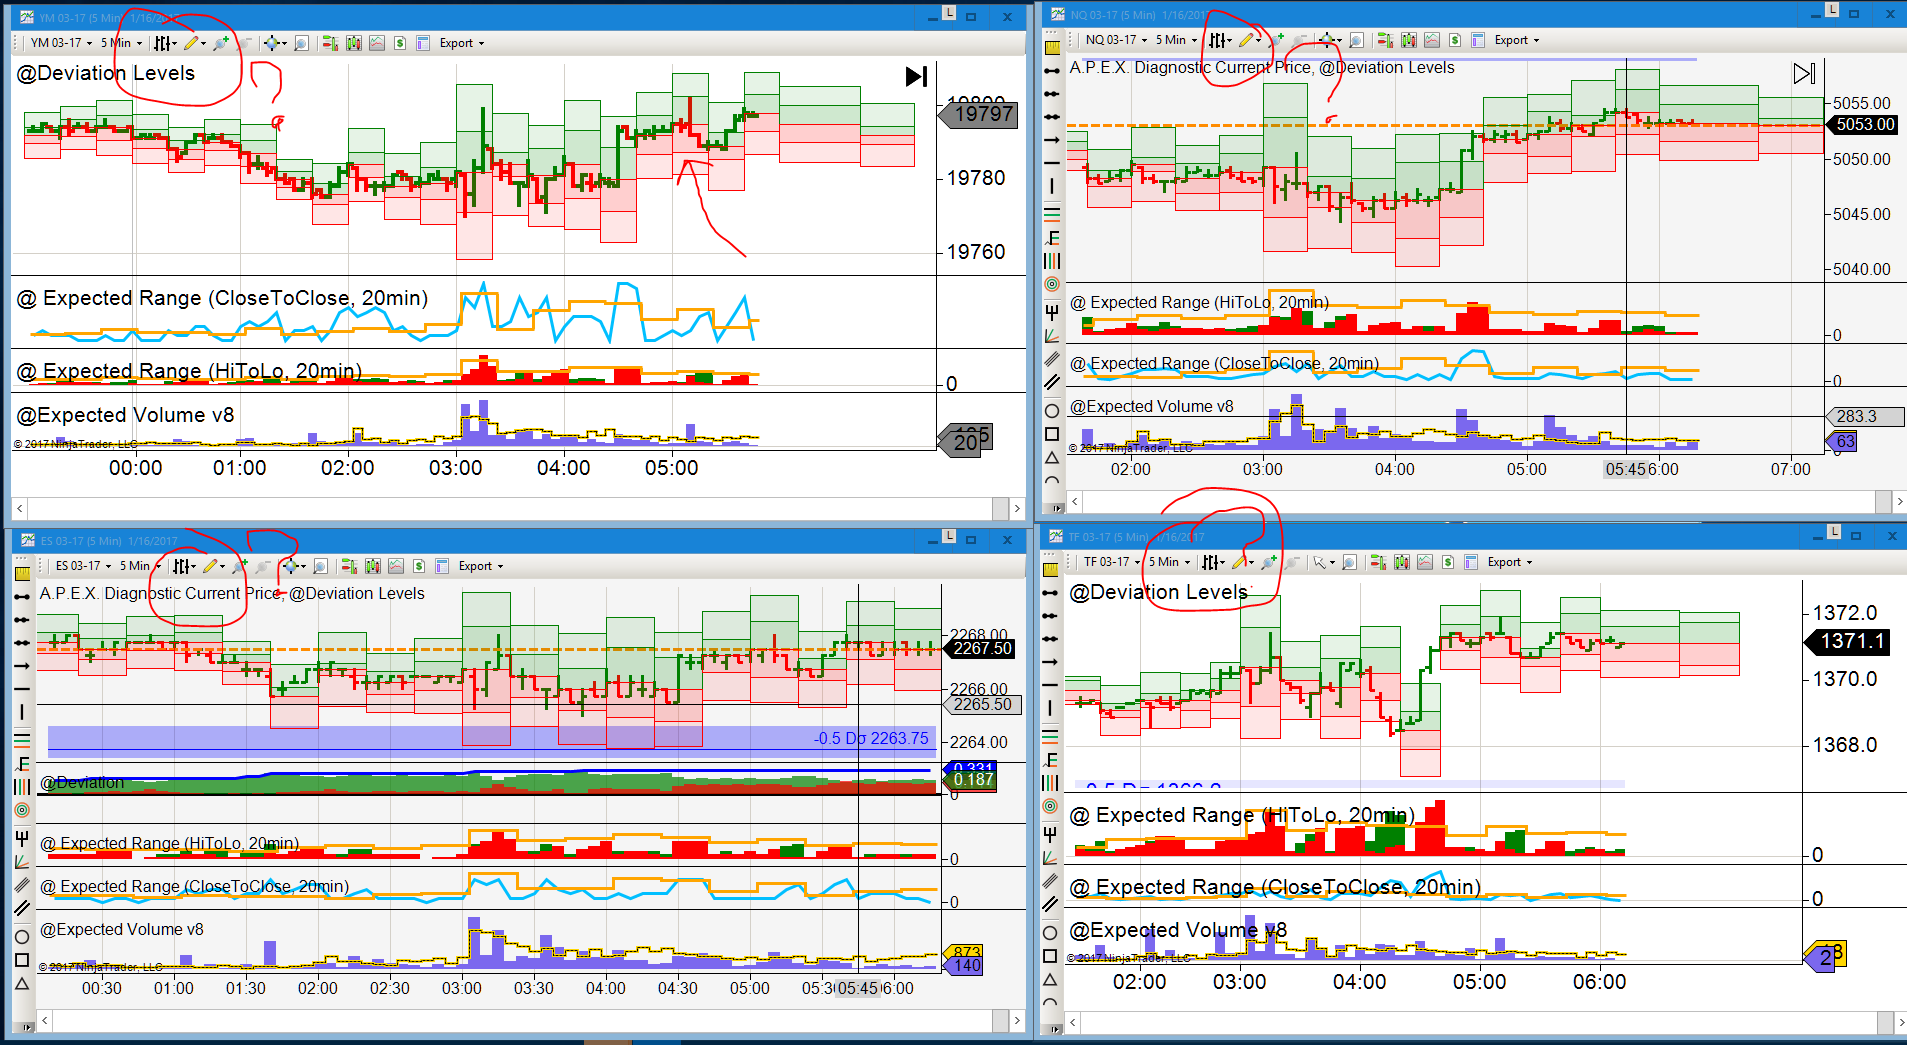
In my effort to learn to do 20 min butterflies and strangles I need to make sure that I have the right expected range chart setup.
The reason I ask is because the charts that I see on the webinars, lets just say do not look the same as what I am able to configure and what you all put show on the tutorials. .
Does it matter if I change the chart to 5 mins does that alter the 6 ticks?
What about the appearance of the bars?
Please see image…
You can use either 5 min or 6 tick, depending on the movement of the markets you are trading. i would test both and see which gives you the best indications based on the markets and times of day you are trading.
You need the Expected Range boxes on the chart itself but you do not have to have the Expected Range under studies at the bottom ,unless you just like to have them there.
The main thing you need to see is the expected volume and the boxes on the chart to see what the market is doing.
Is it volatile and moving or is it range bound and flat with little to no volume etc