By Darrell Martin
When the Gross Domestic Product (GDP) numbers are announced, trading on Wall Street can be affected. The report that was released on July 30, 2015, and came in at 2.3, lower than the expected 2.6, which was not a total surprise but was still reflected in the market.
Leading up the the news release at 8:30 AM ET, the DOW had been bouncing around, hitting some support levels before it finally went down to the 0.7 deviation level giving it an almost one deviation move for this trade. Volume was adequate in the process.
In the following image, you can see the settlement level (17675) from the day before and how the market eventually was trying for a Gap Fill. The market had opened below settlement at 17642 and was trying to come back up to the previous day’s settlement level. This is known as a gap fill even though some trading was taking place overnight. The US markets were closed so it created a gap in between the closing price of July 29 and the opening price of July 30.
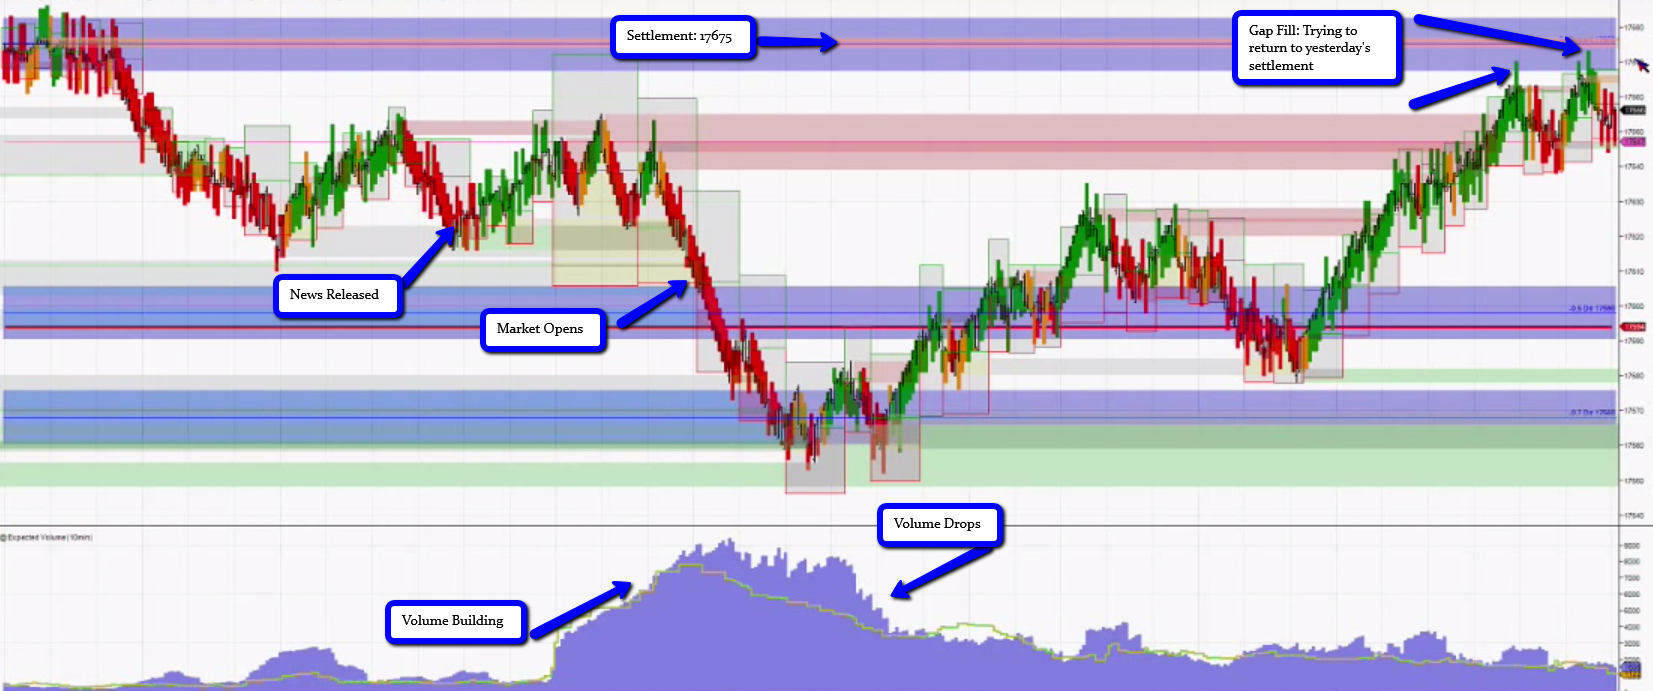
You can also see where the market was trading when the GDP was announced, how the market bounced around for a while and how volume was building during that time. Short trades were being gathered in what is known as an accumulation phase. The image is marked at the bottom showing where volume drops off.
Still looking in the bottom portion of the chart, you can see how volume increased when the market opened, hit a peak right when the market broke through the 0.5 deviation level, but then volume cannot seem to break back above that level.
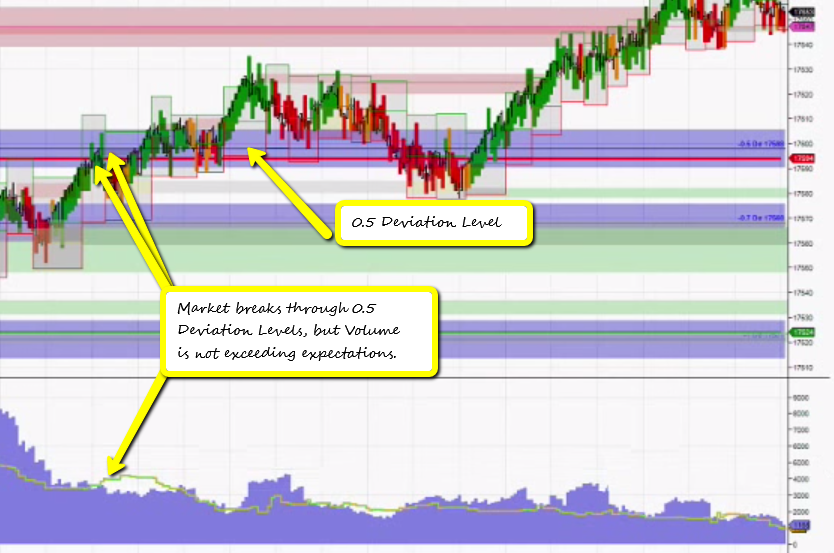
When the price does finally move through the 0.5 deviation level, the volume is not exceeding expectations, which gives the trader a signal to stay out of the trade.
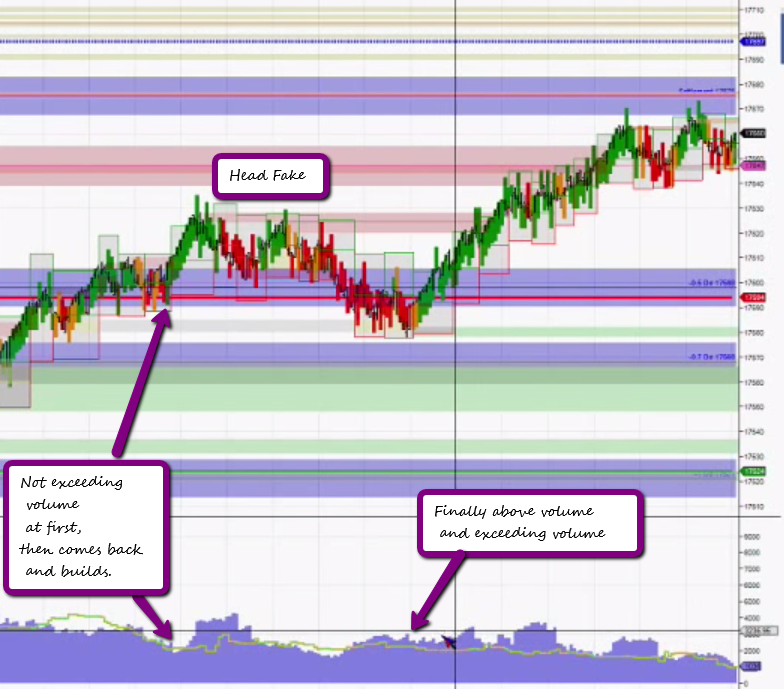
As you follow the movement of the market on the chart, you can see that it was a good thing that you stayed out of the trade. The market started to go up, but then did a “head fake,” where the market fooled you into thinking it was going up and instead came back down.
Finally, volume is staying above the exceeding volume line signifying a chance for a trade. This is good for a long trade putting the target at 17700. However, it will have to break through the settlement resistance level and that could be tough.
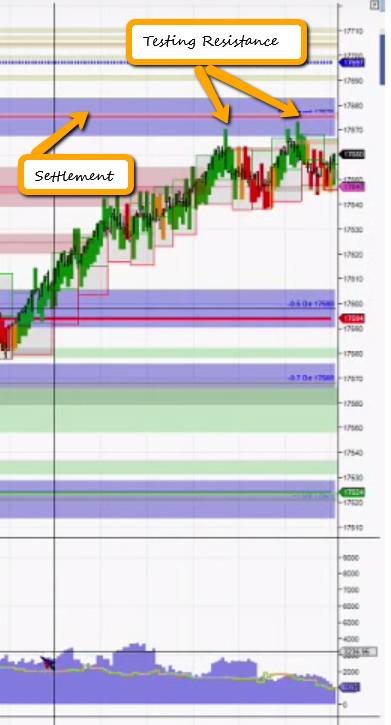
Another look at the chart shows that the market has come up close to the settlement level twice. It is a couple of points off and then it goes back down. If the market can’t break the settlement level, you can expect it to go right back down to 17600. Rather than waiting out such a small move, it would be a good idea to take profit before it reaches 17700.
This is just one analysis of how the market can behave when news comes out and how you can trade at that time. It is important to be aware of volume, deviation levels and what is causing the market to move. For more trading educational tips, please visit www.apexinvesting.com.
You can view the video that this article was based on here.
Duration: 7 minutes
Read more: http://www.benzinga.com/markets/binary-options/15/08/5752702/tips-on-trading-the-dow#ixzz3iRzRLf2P
