by Darrell Martin
Bitcoin. This may be something you wish you knew more about. You may have heard about trading Bitcoin and wondered how you could do it. It may seem unreal since it does not involve anything tangible.
A visit to the Bitcoin web page informs the visitor, “Bitcoin is an innovative payment network and a new kind of money.” It further notifies the public, “Bitcoin uses peer-to-peer technology to operate with no central authority or banks; managing transactions and the issuing of bitcoins is carried out collectively by the network. Bitcoin is open-source; its design is public, nobody owns or controls Bitcoin and everyone can take part. Through many of its unique properties, Bitcoin allows exciting uses that could not be covered by any previous payment system.”
Bitcoin was invented in 2008. In early 2010, each Bitcoin was worth only $0.04. Just last week, on October 29, it was reported that Bitcoin was trading above $314, near the highest since December 2014. This rise in price was thought to be related to the Fed statement that had been released the day before, but also strongly tied to China easing which appears to go straight to Bitcoin. (See Bitcoin Soars Near Highest Since 2014 As China Outflows Accelerate)
Today, CNBC reported Bitcoin trading at more than $410, a price jump of more than 70 percent in one month. According to an article on Zero Hedge, after the price jump, there was a massive sell off causing the digital currency to drop by nearly $50. This article attributes the volatility to the influx of new Chinese buyers who have caused this surge “in order to bypass China’s tightened capital controls.”
As you can see from the news reports above, Bitcoin can be insanely volatile. It can move 40 percent in one day. In checking current charts, Bitcoin has rebounded and is currently trading around $470.
In order to illustrate different ways Bitcoin can be traded, let’s look at how Bitcoin was trading on October 29. Look at the chart below.

This is a Nadex Bitcoin daily chart, which can be accessed from their trading platform. You can see that Bitcoin has surged up through 314. There was some long-term resistance at 314. The market had tested that level in January, February, June and July before breaking through on October 29. When this happens, you can usually expect that it will meet a little more resistance and then pullback.
There are a couple of different ways you can play this. You could expect it to expire below the high of the day at 319. If so, you could check out available strikes that you could sell. When you check for a contract, sometimes there may not be many contracts left, because of the surge in the market. Nadex offers bitcoin binary options with 21 strike prices for the 3:00 PM ET daily expiration, except on Fridays, which lists 15 strike levels. The interval width between each strike level is 1.5.
The next image shows the different strike prices that were available at the time. When you look for the sell strike, you see that there is a 315.5 available for around $21. Choosing this trade would allow you to make a little bit of premium if you wanted to go short.
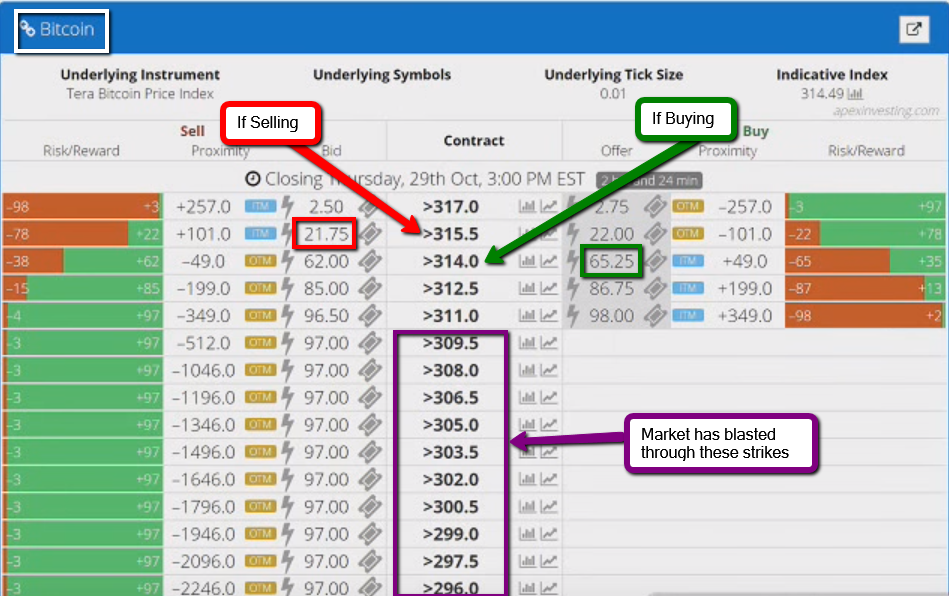
If you believe the market will stay above 314, you can look at buying a contract. Again, checking the strike prices, there is one available at 314 for about 65, with the profit potential of $35.
For October 29, it appears that 314 is the magic number, the resistance level right now. By knowing this information, you can have a better understanding of the expectations of the market. Here is another image taken a short time after the other image, which showed strike prices. You may notice that both the buy and sell prices have increased as has the indicative index.
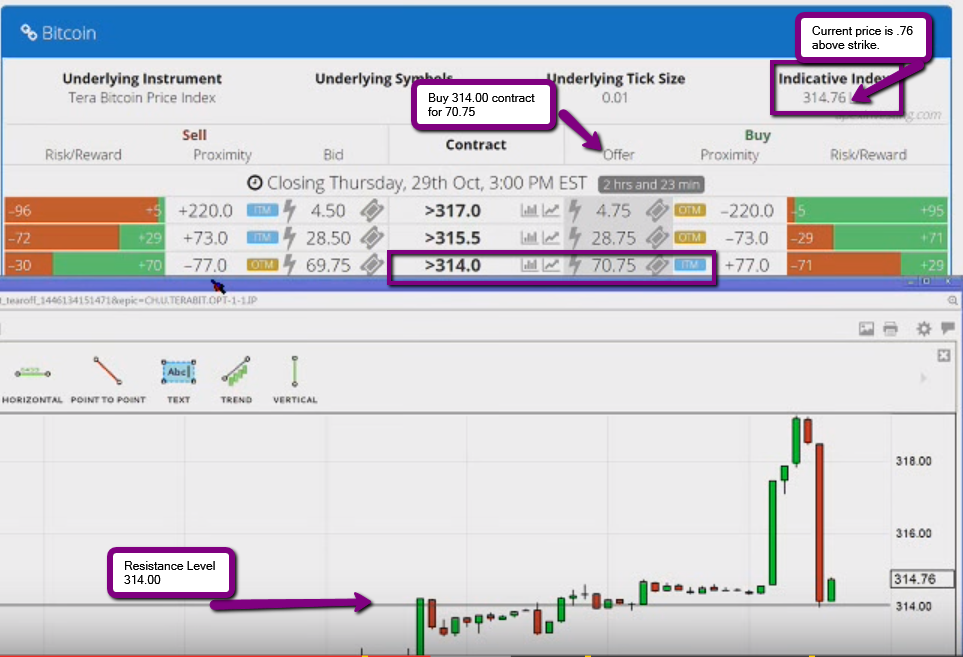
However, for this example, with the strike 314 at 70.75, it is $0.76 above the strike. There is a high expectation of the market staying above 314.
Remember, the first chart was a daily chart. For a better analysis on either of these trades, it would be wise to look at a smaller time frame chart in order to see what you could actually do. When you look at a five-minute chart, it shows how the market popped up and then promptly turned around and went down. Here is a five-minute chart:
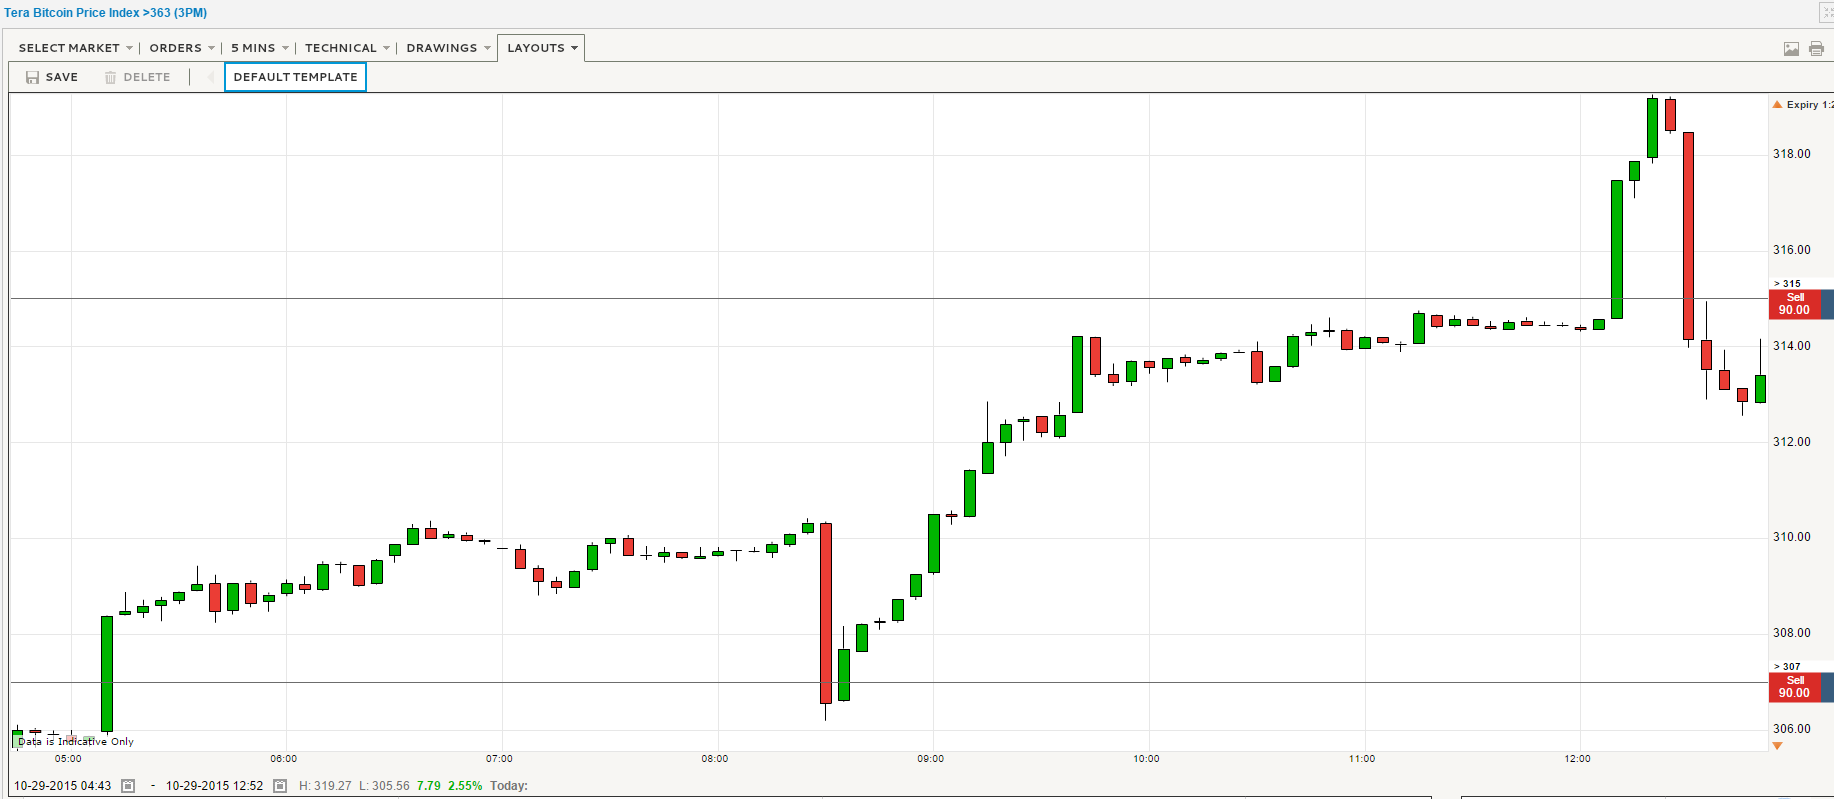
Further analysis using the five-minute chart shows that if there was a shark in the waters and they wanted to push the market a little farther, it is possible they could have caused the big green bar that broke through the 314 resistance. The next green bars are other traders coming in thinking there is a big rally. Take note here, all of a sudden at the short red bar, they start getting rid of their trades. Next, they dump off the rest and everybody bails. This is how it usually goes in trading. This is how you learn to follow the sharks without getting eaten by them and staying out of their way. The sharks will go in, pump up the market and then sell it off. You get your one warning shot, the short red bar, and then BAM! It is over.
With any trade, but especially one with high volatility, make sure that you define your risk when you trade. Risk management is essential to being a profitable trader. To further your trading education, visit www.apexinvesting.com , a service of Darrell Martin.
