By Darrell Martin
Candlesticks, Shadows, Continuum, OHLC, Time-based, Volume-based, Renko, Kagi… These names are just a few of the different types of bars available when you’re setting up your trading charts. They offer and accomplish different things. Of course, as a trader, it comes down to your own preference, but it also helps to know what you want the type of bar to accomplish for you. If you only want it to mark the passage of time or the rotation of the earth, then you will choose a time-based bar chart. However, there is so much more that your chart can do for your trading day!
OHLC (Open, High, Low and Close) and Candlestick bars are the most well known charts, but are still sometimes misunderstood. OHLC shows with one line, where the market opened and closed, as well as where the high and low were for the period represented by that bar, whether it is a week or a minute. The top of the bar is the high; the bottom is the low. A small horizontal tick to the left of the bar shows the open, while the close is a small horizontal tick to the right of the bar.
The Candlestick chart was developed in Japan and is considered the oldest form of charting in the world. They use the same data as the OHLC but in a more visual way. The fatter portion (body) of the candlestick includes the distance between the opening and closing prices. If closing price is higher than opening, the candlestick is white. If the closing price is lower than the opening price, it is black. Some platforms use red and green instead of black and white. A thin line called the shadow marks the difference between the high and the low.
Different platforms use different variations on these basic bars for their charts. You can trade using Time-Based OHLC Candlesticks, Price-based OHLC Candlesticks, Time- and Price-based Candlesticks or OHLC.
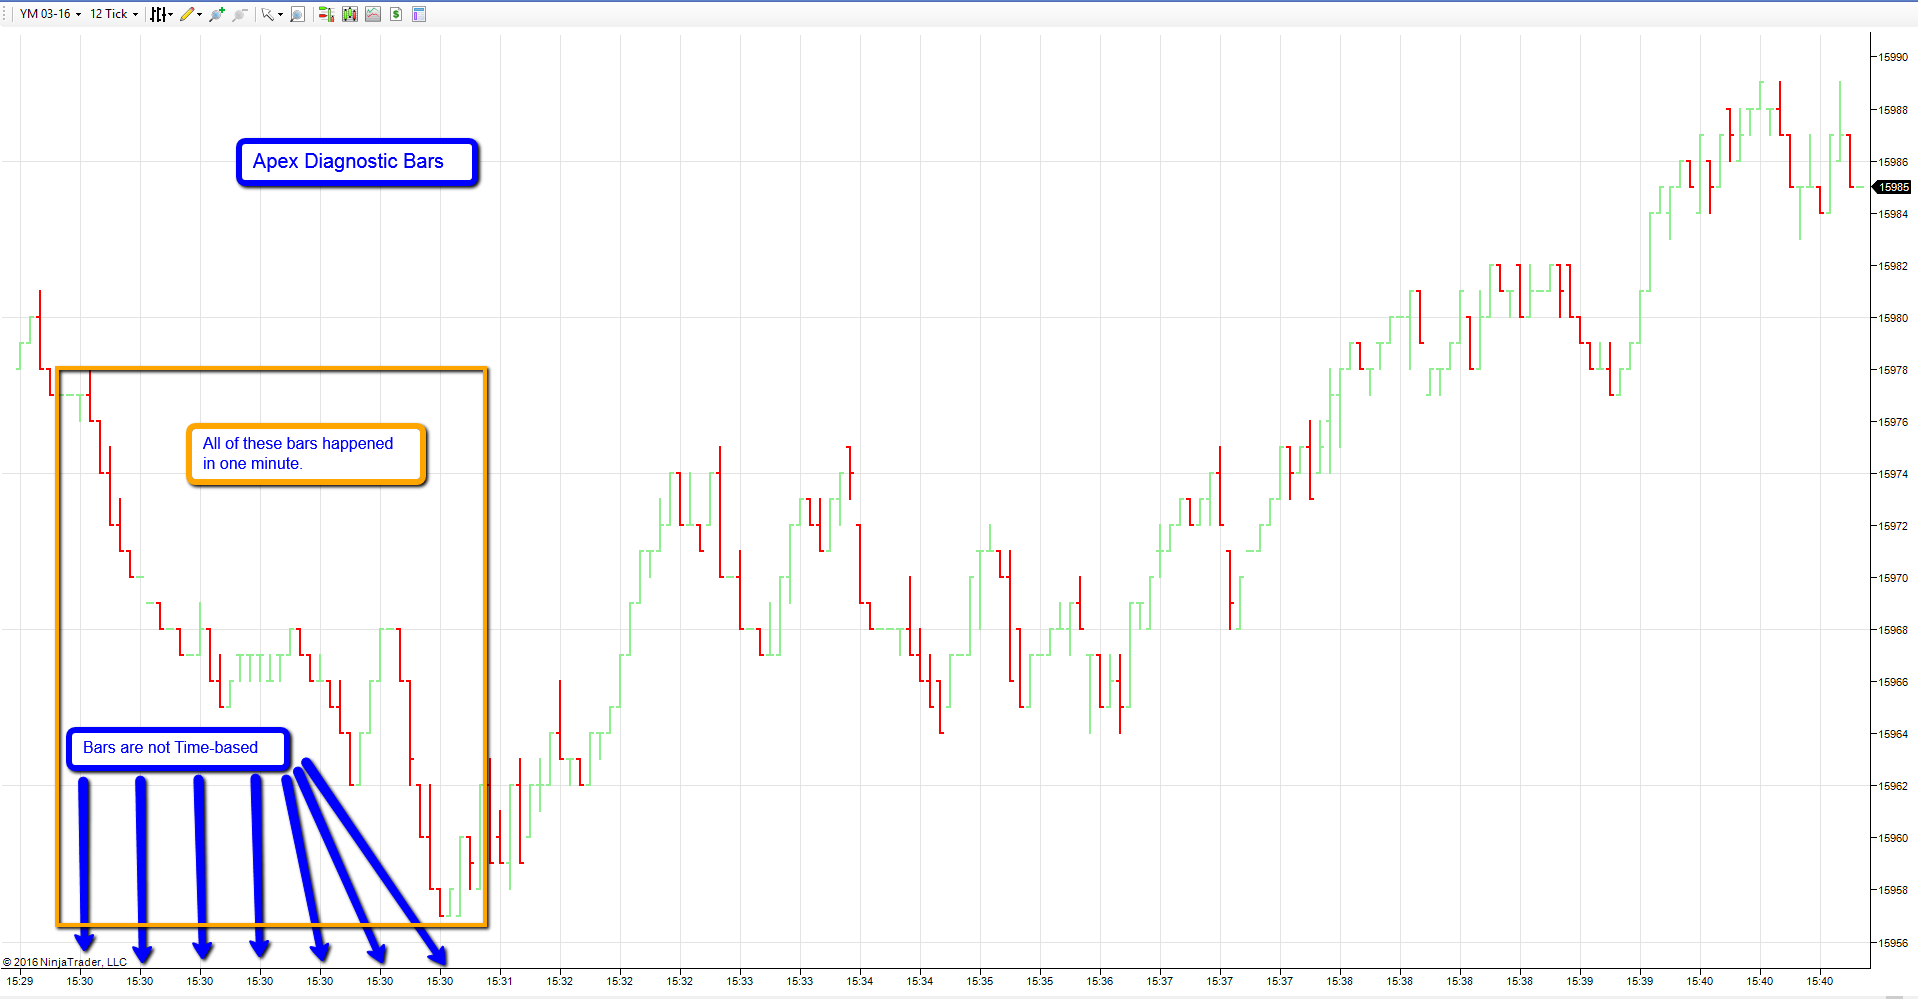
When trading binary options or spreads, the passage of time does not always mean there has been movement. One tool which is useful is the APEX Diagnostic Bars, which plots bars according to movement, not time. In the image below, notice the many bars plotted in one minute!
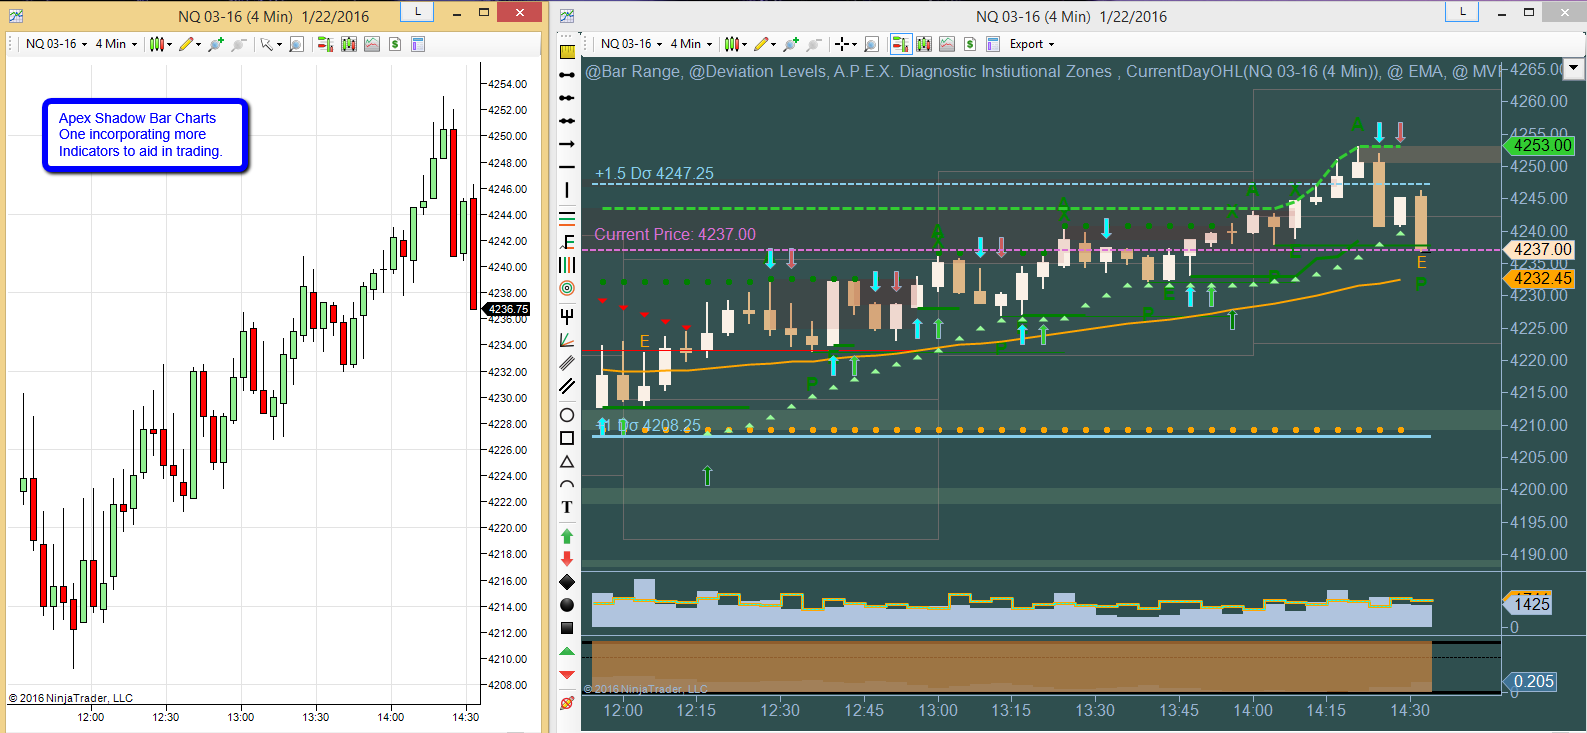
Building on the theme of movement based bars, Shadow bars follow the Diagnostic bars. These bars gave the trader the benefit of Diagnostic bars with the clarity and accuracy of real pricing as well as accurate reversal percentage size. Shadow bars improved the reversal percentage feature allowing it to plot historically.
The following image shows typical shadow bars on two charts. The chart on the left shows only Candlestick Shadow bars. The chart on the right incorporates more indicators with the Shadow bars to help you in trading.
Continuum bars were the next type of bars developed by APEX. Similar to Shadow bars, they have the added features of tracking time and price action. This allows you to have a bar plotted when the market moves x ticks or every x minutes. This type of chart is advantageous for trading all binary options, spreads and even futures.
The chart below shows Wall Street 30 (YM) Continuum bars incorporating other indicators for trading.

The bars and the indicators on this chart suggest a beautiful short trade at about 13:30 ET. When everything lines up according to your strategy, then you can confidently place the trade.
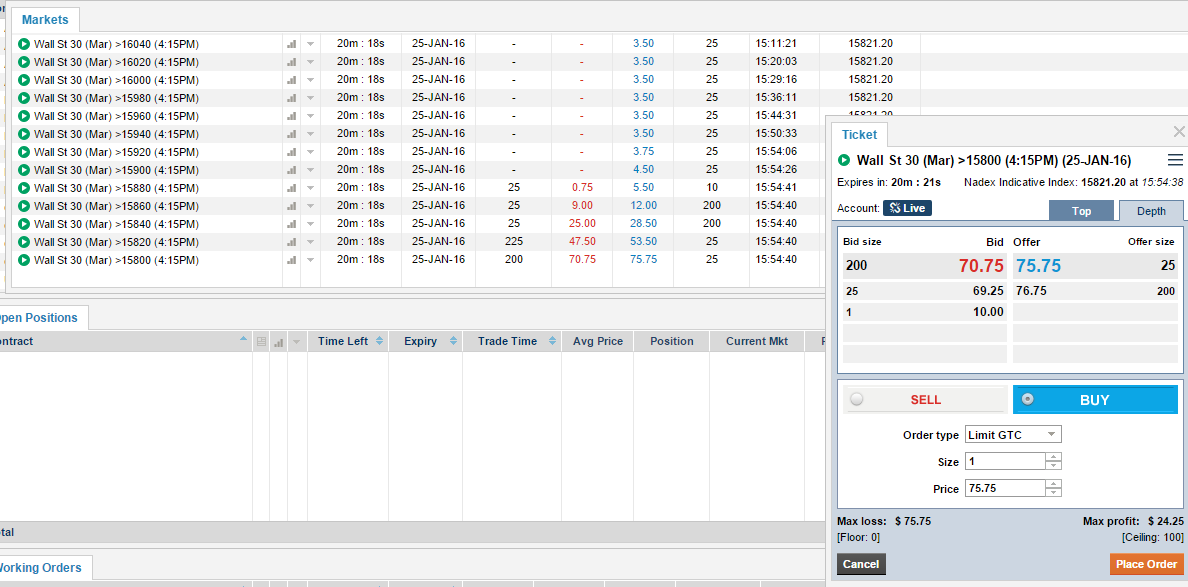
There was a possible long trade at 15:48 ET. The indicative was 15821.20 and the trader chose to buy the Wall St 30 >15800 at 75.75. (See binary ticket below.) The trader managed the risk on his trade by trailing his stops and was stopped out at 15:55 ET.
Knowing what different bar types are available and how they portray information can help you make informed trading decisions.
