By Darrell Martin
If you trade Google you may be interested to learn that the CBOE has a Volatility Index for Google. You can add this to your trading tools to give you an edge on the next Quarterly Earnings Report. CBOE has a wealth of information available to help you if you trade Google. Click HERE. to access that information. The chart below shows how the VXGOG corresponds to movement on GOOG.
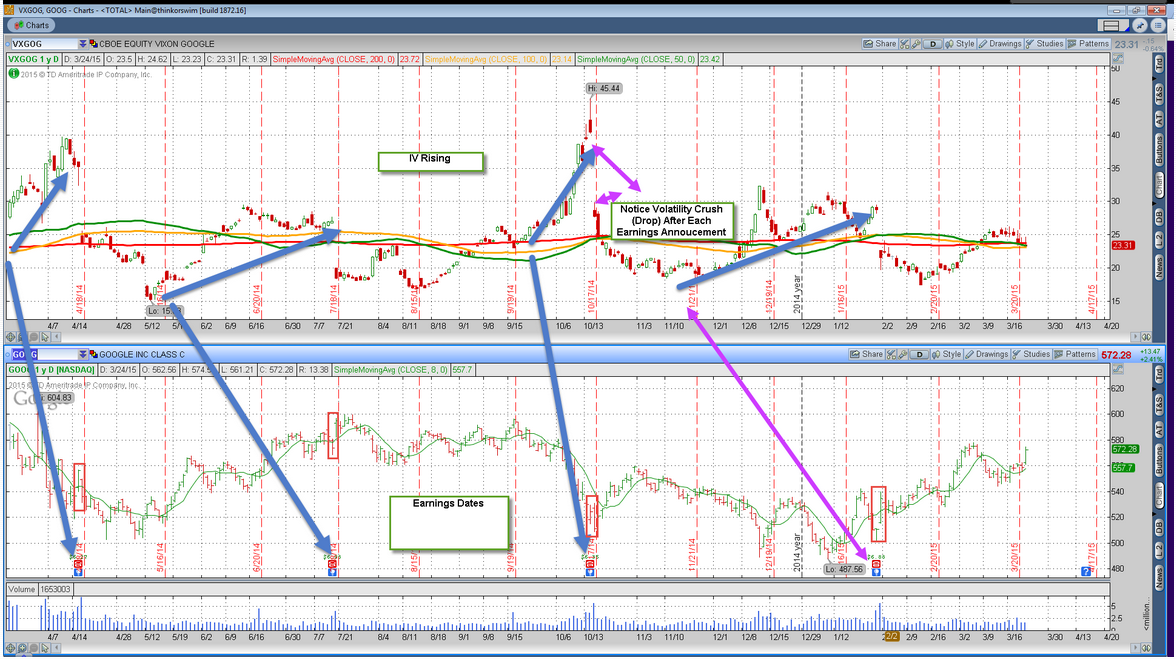
You will notice that leading up to the release of an earnings statement, there is a gradual increase in volatility. This usually happens for approximately 30 days before the news comes out. Once the announcement is made, BOOM! Volatility drops. Do you see the pattern? Can you see how implementing this strategy into your trading could benefit you? As the Implied Volatility (IV) goes up, options get more and more expensive. When IV drops, that movement is called the “Volatility Crush.” It’s a simple pattern that can keep you from getting crushed. If you buy the most expensive options and sell the cheapest ones, you are getting crushed. Using a Volatility Index like VXGOG will help you to be able to see this pattern. It gives you a smoother IV number to read. The following short video shows how the VXGOG works with the simple moving average lines that we have described in previous articles.
Even if you are not a Google trader, you are probably aware of how the earnings release statements can affect other markets. Knowing about Volatility Indexes is important if you trade Futures, Stocks, ETFs, Options or Nadex Binaries. If you would like to further your trading education, visit www.apexinvesting.com, a service of Darrell Martin.
Read more: https://www.benzinga.com/markets/bina…#ixzz3VdCt23eY
