Settlement and deviation levels are essentially an educated guess as to the range a market price will exist in for a given time period. (Note, there are different ways these levels can be calculated. Read on to understand what they represent and the difference between how the Apex indicator determines them and other ways they might be derived.)
Apex deviation levels are daily. So Settlement is just where price “settled” the day before, the end of day price (i.e. where price was when market closed). Deviation (dev) levels are the different degrees to which the market is expected to “deviate” from that level today.
The most fundamental idea with a deviation indicator is an attempt to estimate how much movement the market will have (aka “volatility”). So you’re taking “settlement”—where price was when the market closed the day before—and then calculating the statistical probability of price deviating from settlement to varying extents.
Standard deviation
The term “standard deviation” is a mathematical nomenclature from statistics, referring to the variation in a set of data.
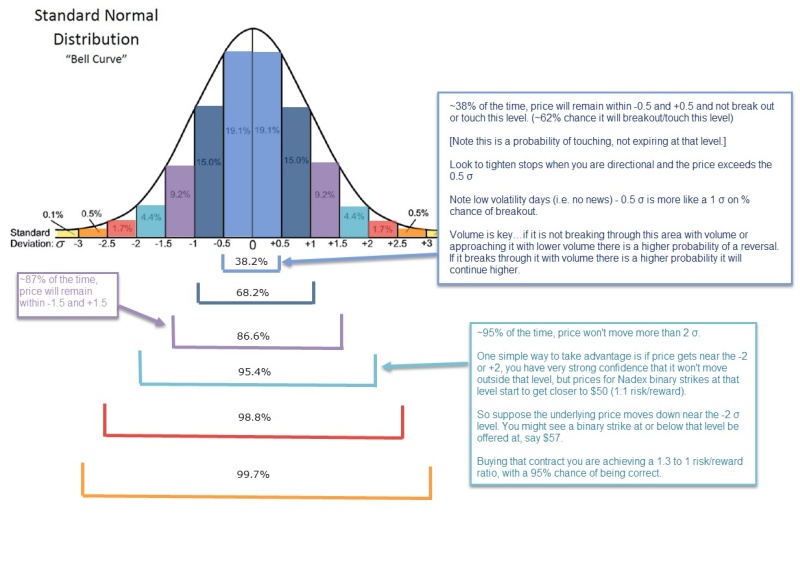
In a normal distribution set, 68.2% of values will fall within 1 standard deviation from the mean, 95.4% within 2 standard deviations, and 99.7% will fall within 3 standard deviations from the mean. The Greek letter σ (sigma) is the common representation for a standard deviation of volatility. In other words, -1σ and 1σ are just whatever two numbers that include 68.2% of the closest values from the mean between them. (See illustration below.)
So basically, the idea in terms of a market price is:
±0.5σ = 34.1% chance price will not break out or touch this level (66% chance it WILL breakout/touch this level).
±0.7σ = 47.6% chance it will not break out or touch this level
±1σ = 68.2% it will not break out or touch this level
±1.5σ = 86.6% it will not break out or touch this level
±2σ = 95.4% it will not break out or touch this level
±3σ = 99.7% it will not break out or touch of this level (0.3% chance it will breakout/touch this level. In other words, it is very rare to see price reach 3 deviations)
This is illustrated here:

***SPECIAL NOTE***
DO NOT misunderstand this. The above IS NOT a probability of the day closing with price in between those values. A VERY COMMON MISTAKE is to see price break out of one of those areas and assume the probability represents the odds of price returning to that range.
For example, suppose price drops below the -1.5σ. It is common for people who are not reading carefully for comprehension to mistakenly think this means they should go long, because “86.6% of the time, price stays in between 1.5σ and -1.5σ…so I have an 86.6% chance of price going back up above -1.5σ!!!” Wrong.
Once price breaks out of the range, all bets are off for that range. If price drops below the -1.5σ, it means today’s price movement is part of that 13.4% of the time that that range gets broken. Deviation levels have nothing to say about a probability of price returning back into a range once it has broken out.
Volatility
How much price moves is often referred to as “volatility”. Volatility, by common definition in finance, is just the annualized standard deviation of logarithmic returns.
Now, in finance there is “historic volatility,” which looks at past market prices of an asset, and “implied volatility” which is forward-looking, and calculated from the current market pricing, often of a financial derivative (options).
A list of the different ways implied volatility can be calculated is found here, but the important differentiation to understand is calculating from historical data versus current data.
Apex deviation levels are calculated using implied volatility derived from current options pricing, resulting in a standard deviation set that is considered a more accurate measure of potential price movement than if historical volatility was used.
Usage in trading
Deviation levels are a common measurement in finance used by many traders in many different markets in many different ways. The simplest way to look at them for your purposes in Apex system trading is to consider them significant levels…meaning they could act as strong support/resistance, magnets, and/or areas of chop.
Be aware of these levels and execute your trades accordingly, recognizing how they may influence price in the ways listed above. If a trade is headed in the direction of one of these levels, it may be a good profit target (or you may wish to take profit earlier and leave some room in between, in anticipation of chop or an early reversal before actually reaching the level). If price is close to the level or is fluctuating around/through it, and a trade sets up, you may wish to stay out of the trade entirely to avoid getting chopped out.
There are many ways these levels might be used. Pay attention to how price reacts around them and see what patterns you can observe over time.
