Shadow bars:
The new shadow bars allow the trader to use the benefit of diagnostic bars but get the clarity and accuracy of real pricing as well as accurate reversal % size. The classic diagnostic bar standard uses a 50% open, which means it fills in on the 1st tick of the formation of that bar from the open to the 1st tick with the open plotting at 50% between the open and the close of the previous bar. It used 100% of the brick/tick size for reversal size. For a 12 tick bar size it would mean 12 ticks from the painted open (that is 50% between the open and close of the previous bar); so if the market moved to a price up 12 ticks above that open and moved 1 more tick up or down to a price that is 12 ticks below that open and moved 1 more tick down it would close the bar and plot the 1st tick of the new bar. This allowed for diagnostic bars to paint accurate highs, lows and closes and smooth out the chart with the 50% open. Since indicators are based on the close this had no impact on indicator calculations. The reversal % did not work properly as historically it would plot; for example, 36 ticks from the open on a reversal on a 300% reversal and then make it into 3 bars and so it was locked at 100%.
**The formula to create a 100% true tick diagnostic bar using shadow bars is the following:
Size of Diagnostic bar divided by 2 then subtract 1 for Trend Brick Size which would be the same as Diagnostic Bar/2 - 1 = Trend.
Size of Diagnostic bar times 1.5 then add 1 for Reversal Brick Size which would be the same as Diagnostic Bar x 1.5 +1 = Reverse.
This will create the problem of seeing bars of different “sizes” from open to close which is visually distracting. Hence the introduction of the SHADOW in the [Bar Style indicator].
Shadow bars solve the above issue by allowing you to define the trend and reversal tick size.
The trend size is x ticks from the true open + 1 tick before a new bar is formed.
The reversal size is x ticks from the true open + 1 tick before a reversal bar is formed.
Since the bar has to move (in this example) 6 ticks on a 6 tick bar, it will not form a new bar until the 7th tick.
To make the shadow bar closely resemble that of a diagnostic bar, go to the Bar Style indicator and change the shadow from automatic to manual and set shadow to be equal the diagnostic bar size less the trend size, i.e., if you want a 12 tick shadow on a 5/19 bar (for 12 tick diagnostic) you use 7 this will make all shadows look like 12 tick diagnostic except the reversal bar.
The settings for a 12 tick bar would be:
Trend size = 5 ticks; Reversal size = 19 ticks; Shadow Set to Manual and 7 ticks. (See the first screenshot for example.)
The settings for a 10 tick bar would be:
Trend size = 4 ticks; Reversal size = 16 ticks; Shadow Set to Manual and 6 ticks.
The settings for an 8 tick bar would be:
Trend size = 3 ticks; Reversal size = 13 ticks; Shadow Set to Manual and 5 ticks.
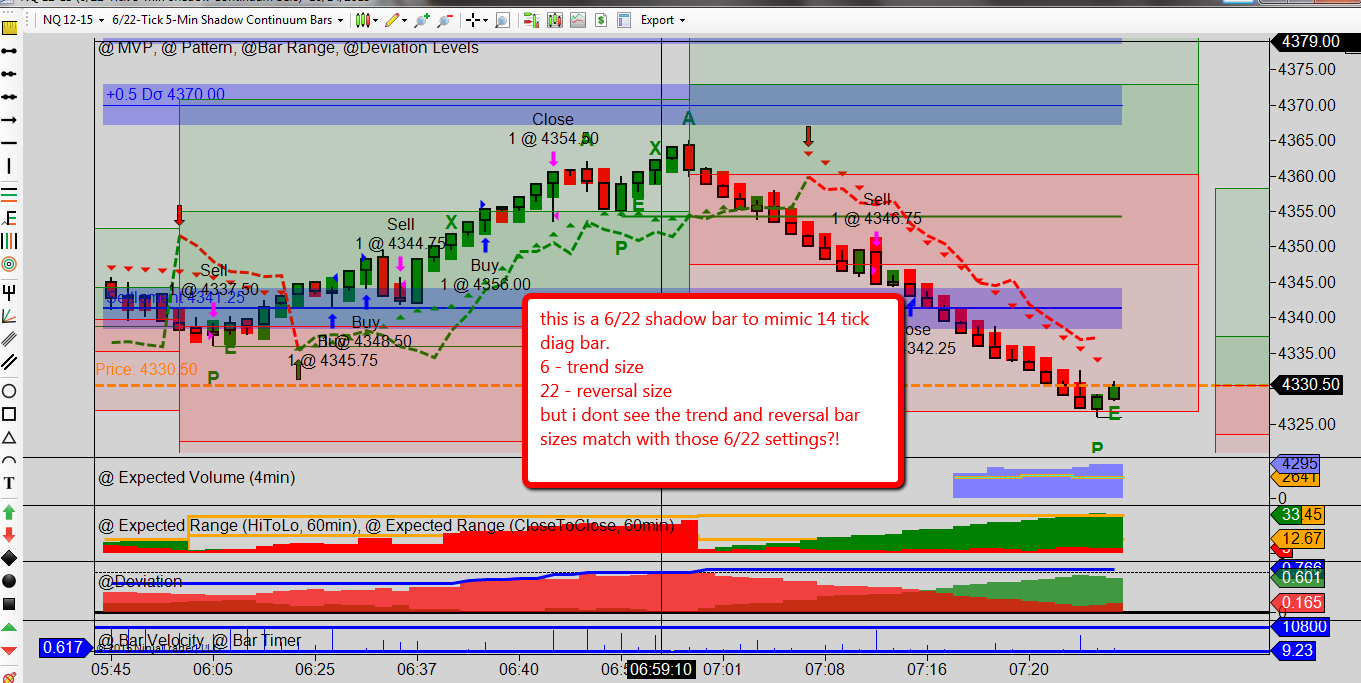
The settings for a 6 tick bar would be:
Trend size = 2 ticks ; Reversal size = 10 ticks; Shadow Set to Manual and 4 ticks.
An example of the above on a 3 tick bar would be: Trend size = 1 tick Reversal size = 5 ticks Shadow Set to Manual and 3 ticks…
You also can do other combinations:
Some of Darrell’s favorites are: 2 trend and 10 reversal and a 3 trend, 12 reversal. Feel free to experiment - these are the 2 you will see Darrell use most often.
The shadow allows you to have the smoothing bar look but still have the ability to see the real open high low close. (Now you will know if the market actually pulled back or not on those tighter stop scalp trades.)
When opening a new chart, here are the setting that can be adjusted in the data series when selecting your market and bar type:

If you wish to customize the Shadow bars, there are other settings that can be adjusted in the Bar Style indicator which must be added to the chart for adjusting both the Shadow and Continuum bars.

When opening up a new chart, if you have not added it, you will be prompted to add this indicator. It is recommended you add this indicator to your default chart template so when you build charts you wont have to remember to add it. (You can do this by starting a new chart, putting in the bar type you want to use, add ONLY the Bar Style indicator and then save template as default.) Next time you open a new chart it will be there automatically. The bar style setting indicator will let you change colors, tick widths and bar style ( OHLC or candle) for the Shadow or Continuum bars. It also allows you to choose if you want the shadow automatic or manual and the size of the shadow which will allow you to set the “shadow” on a bar to smooth it out visually more like a diagnostic bar or just fill in the bar and turn the shadow off.
As shown in the screenshot above, you can edit the shadow that is drawn by changing it from automatic to manual. This can be used to help you have a visual stop or smoother bar. If you want your shadow bar to look like a classic 12 tick diagnostic bar for example, you set the shadow to manual and 7 . This will emulate a classic diagnostic bar, i.e., 12 ticks for a 12 tick normal diagnostic bar. The screen shot shows you how this would look.
You can make the shadow smaller or larger to fit your needs. You can set to automatic and 0 if you want to turn off the shadows completely. This would simply color in the bar with no shadow showing at all.