Darrell in the Elite room May 2, 2017](https://www.youtube.com/watch?v=pOaUWyiy_a8)
Conference room tips using VAD and Bar Timer - Lori
THT - Chop breakouts indicated by VAD 10 17 2016 Lori
WHAT IS IT: Volume Accumulation and Distribution (VAD) indicator measures the volume within a trend from point A to point B. It is very different from other volume indicators which measures the volume in a bar.
5 different algorithms written by Darrell Martin:
Combining:
Trend direction
Price action
Volume Order Flow based on absorption
These screenshots describe how the VAD indicator shows divergence which is signalling the strength in a trend.
Example of buying divergence setting up a potential sell opportunity verified with another system. VAD is an indicator to be used in conjunction with other indicators and systems.
Example of selling divergence setting up a buy opportunity.
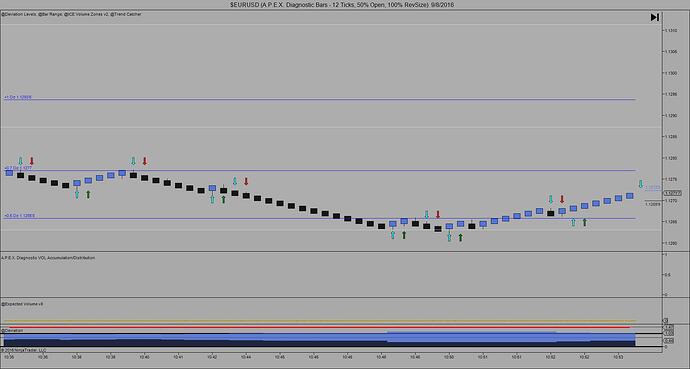
The screenshots below illustrate how the VAD shows overall on a chart.
*** Diagnostic bars work best with the VAD indicator.**
There are a few setting adjustments that may be made to personalize how the VAD indicator shows up on the chart.
USING VAD WITH FOREX
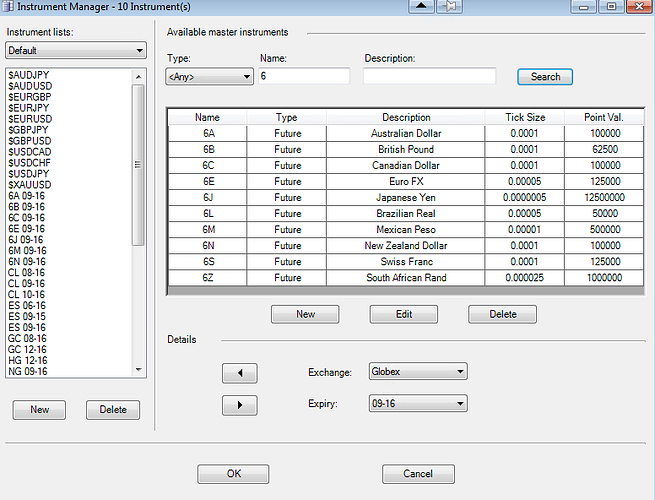
The indicator is defaulted to typical forex settings. The current corresponding futures markets must be loaded in the Instrument Manager in Ninja 7 in order for this indicator to work properly. For example: If trading the pair GBP/JPY, 6B and 6J must be loaded in the Instrument Manager with the current expiration. The same would hold true for EUR/USD, 6E must be loaded in the Instrument Manager
-
There is an option to use futures volume, but when this option is selected, the bars will not match exactly color for color. This is expected.
-
There are times when forex markets are shut down and no volume shows up. This is denoted with a “not in session” color coding.
A simple template will be added to the toolkit to make seeing how the VAD works easier. The name of it is _VAD_simple. This is what it looks like:


